
⭐ 🛰️ Outdoor GPS Market: Key Vendors, Trends, Recommendations to Pro Teams (2nd Edition)
With 20+ leading GPS vendors (Catapult, STATSports, WIMU, McLloyd..) in the market today, GPS systems have become one of the most common tech used by pro teams today. Simply put, sports teams have to pick the right GPS system that fits their requirements, use cases, budget, and GPS accuracy requirements. In this analysis we will discuss the current and future market trends, VC/M&A investment trends, the GPS vendor ecosystems, and the key GPS vendors. We will also provide recommendations to pro teams looking to adopt a GPS solution.
What are GPS systems?
GPS systems, also known as Global Positioning System, have been used by pro teams for a long time. GPS systems, used in Player Tracking devices, enable teams to track players’ movement and measure data such as running speed, position on the pitch, distance run, and even their heart rate. Player Tracking devices typically use 4 types of sensors: an accelerometer, a gyro, a magnetometer and a GPS module.
Generally speaking, teams use Player Tracking devices to help them prevent injuries. By tracking a player's sprints and distance covered the coaching staff can determine whether the player is fit for their next game or could benefit from resting.
These Player tracking systems are best when combining GPS metrics with other data points in order to get the full understanding of the players’ health.
The most common data point being collected are:
Total distance covered
Average running speed
Total running distance (high pace)
Total sprinting distance (full speed sprinting)
Average acceleration time
Average deceleration time
Heart rate (to identify athlete's work rate)
Positioning on the field
Time of high intensity play
Time of low intensity play
Athlete's load (the demand on an athlete's body)
G-Force / impact data
According to a study entitled Tracking Systems in Team Sports: A Narrative Review of Applications of the Data and Sport Specific Analysis, in the applied sport environment, there is a need to distil the myriad of metrics into concise, meaningful information. Decision makers (e.g., coaches and performance staff) require simple, accurate, and coherent feedback, including succinct conclusions from data in a timely manner [11]. It is advisable to include stakeholders in the metric selection process, as coaches have expressed an interest in tracking data pertaining to ‘high-intensity’ actions and ‘intensity’ [12]. Indeed, greater involvement and improved communication in this process could help to avoid a detrimental gap between information and its impact [13].
A variety of considerations for selecting metrics are shown in Figs. 1 and 2. These include, but are not limited to: playing dimensions, player density, position characteristics, game rules, and timing structure. The combination of these factors demonstrates the importance of context both between and within sports.
As an illustration, it could be questioned if tracking an athlete’s maximum velocity is pertinent in basketball, given the limitation of court size. Similarly, absolute high-speed running (HSR) in American football may be much less meaningful to linemen than wide receivers due to their unique positional characteristics (see Sect. 4). However, this process presents somewhat of a paradox; the practitioner may first have to measure the characteristics to determine its meaningfulness and then be able to apply critical thinking in order to determine the most appropriate measures to the sport.


Figure 2: A bar chart visualising the difference in playing time and actual time during match-play across different team sports. Continuous play is shown in solid blue. These sports may have pauses in play for substitutions but do not have pauses in game-play periods for commercial breaks or time-outs. Sports of a play-by-play nature (clock stop), with intermittent breaks, for example for faults or commercial reason, are shown in striped blue and grey
Subjectivity is important in the critical selection of metrics, based on the sport and/or position characteristics. However, despite a more subjective process based on observation, it remains that such metrics should still demonstrate face validity (perceived to be relevant) and high content validity (representative of the construct, in this case external load) —for further information, interested readers are directed to [14]. There may be scope to further support this process with objectivity via statistical analysis of the existing suite of metrics available.
Weaving and colleagues (2019) demonstrated how principal component analysis, a linear algebra technique, can reduce and visualise complex tracking data into meaningful components [15]. This approach can help the practitioner to understand multi-collinearity between metrics and therefore, filter out redundancies [15].
For example, in professional rugby league, such analysis suggested some measures of training load (e.g., training impulse, session rating of perceived exertion, body load, high-speed distance, and total impacts) may be used interchangeably to describe small-sided game and conditioning loads, but not for other modes such as skills, wrestling, and speed training [16]. Similarly, by using feature selection in the time and frequency domain, team sport related activities can be accurately classified through a single tracking device.
This approach may allow for the generation of more sport and activity specific algorithms, from one device [17]. Such approaches may be especially worthwhile, given that a multivariate approach to monitoring has been recommended for team sports [16]. Focus should therefore be given to developing and improving metrics already in use, ideally through the integration of physical and tactical insights into combined metrics [18]. The onus is thus on the practitioner, to determine the most relevant metrics to interpret and communicate with key stakeholders.
The workflow of selecting the most pertinent tracking metrics is an ongoing process, requiring current knowledge on the validity and application of tracking technologies, based on research and technological advances. Recently, the measurement and management of decelerations have been declared important to capture, given their distinct demands and potential as a critical mediator of neuromuscular fatigue and tissue damage [19]. However, concerns have been raised regarding the precision of tracking devices to capture accelerations and decelerations [20]. Whilst sport and tracking technologies are constantly evolving, practitioners need to balance innovation with an understanding of the precision and sensitivity of technology.
Sport Specific Analysis
Context will drive what technology (and in turn, metrics) should be selected to capture the characteristics of team sport athletes during training and competition.
For example, in basketball and netball, the use of GPS is rendered inoperable, given at the elite level both sports play and train indoors. Therefore, LPS, IMU and optical tracking are more appropriate. Similarly, the use of optical tracking to monitor athletes during Australian football and rugby codes may be limited, given the large (and varying) field sizes, whereby many cameras would need to be installed at height around the ground.
Therefore, the tracking technologies and derived metrics used for specific sports and playing positions need careful consideration. Below we have arbitrarily selected team sports and introduced sport-specific considerations that practitioners should be mindful of, when selecting the technology and corresponding metrics to profile the physical characteristics of athletes during training and matches.
American Football
American football is an intermittent, contact sport characterised by physical demands that include HSR, accelerations, decelerations, and changes of direction [100]. The game is play-by-play in nature across four 15-min quarters, with multiple stoppages and commercial breaks, extending the game length, in actual time, to upwards of three hours (Fig. 2). Players are selected from a roster of 53 to 120, depending on the time of the season and the level (i.e. collegiate vs professional) with specialist positions across defense, offense and special teams [101]. Factors that set this sport apart includes the vast differences in positional characteristics, the mandatory inclusion of personal equipment (i.e., helmets and pads) that in turn likely influences the magnitude of collisions, and the prolonged time course over which the game is played. As such, there are nuanced considerations for applying tracking data in this sport.

The wide disparity of positional characteristics in this sport provides practitioners with challenges related to both physical preparation and tracking itself. The process for selecting metrics may be especially pertinent given that the notable difference in positional characteristics may lead to the focus of different metrics for different positions. Differences in running, assessed via HSR, and non-running, assessed via total inertial movement analysis (IMA) from the IMU, characteristics were notable across position groups during a professional training camp [102]. Similar differences have been illustrated in training and competition characteristics at the collegiate level [100, 103, 104]. While the use of IMU data may help to capture sport-specific actions (e.g., throwing, contact, and collisions) and be developed into position-specific metrics [105], this technology may still be unable to fully quantify some characteristics that rely less on movement tracking, such as the high isometric demands of grappling and blocking. Further, IMU technology is not permitted in competition at the professional level, wherein Radio Frequency Identification technology is currently employed [106].
Given the heterogeneity of the physical characteristics by position, relative velocity thresholds may be pertinent. Ward and colleagues (2017) used a HSR threshold above 70% of the maximum speed for the respective position group, derived from training sessions within the previous year. Absolute speed zones for the entire team, which may over- and under-estimate demands for faster and slower athletes respectively [100], have also been utilised.
However, it is also important to note that research in other sports (soccer) found the use of relative speed thresholds did not better quantify the dose–response and, in fact, the application of a player’s peak speed to establish speed zones may result in erroneous interpretations [107].
More research is required in American football to determine the most suitable approach for quantifying the dose–response relationship, especially given the wide heterogeneity of characteristics by positions and also the variation of intensities within position-specific periods in a training session [102].

The heterogeneity of American football characteristics is exacerbated by the special teams element. During these passages of play, a mixture of offensive and defensive players (generally non-starters) combine to perform roles in support of specialist kickers, who are attempting punts, kickoffs, and/ or field goals. Thus, practitioners are challenged to prepare these players for the physical characteristics of both their primary and special teams roles concurrently. For example, a Linebacker who is also a special teams specialist, may play across all four phases of Punt, Punt Return, Kickoff, and Kickoff Return. If an injury occurs, the planned roles may be further influenced. These passages of play may often be the most physically demanding with regards to HSR (unpublished observations), and so there are repercussions for tracking the physical outputs of these passages, both in terms of understanding the specific characteristics and monitoring the external load each individual player is subjected to.
There may be further disparity in the physical requirements for players within numerous periods of a training session. Whilst a session may be divided into five key periods (i.e., warm up, position-specific training drills, special teams drills, preparatory plays, and team periods [102]), players may be required to work on different characteristics during those time periods, based on their role. For instance, starters not involved with special teams may be training separately according to their position role on offense and defense during such periods. This is an important contextual note for practitioners attempting to categorize, analyze, store, and plan periods/drills using a database.
Considering the physical characteristics of a session, period or individual play level, is worthwhile in the planning process, as American football is a sport characterised by a high tactical demand. With an intermittent play-by-play structure (Fig. 2), players are expected to learn set movement demands outlined in a playbook, more akin to set pieces in other sports. As such, certain time epoch analysis, including segmental analysis, rolling averages or game speed approaches, may be less relevant to track in this setting. Rather, tracking outputs on a specific play level may be more pertinent.
Given the prominence of the integrated combination of physical, tactical, and technical characteristics of the game, there may be benefit in aligning tracking data with video and play/scheme notations to understand the physical outputs within the game context. Indeed, machine learning techniques are exploring the ability to classify route combinations, blocking assignments or coverage type from tracking data [108].
Australian Football
Australian football is an invasion-sport contested between two teams of 22 players, 18 permitted on the field and four on the interchange bench. A unique constraint of the sport is the non-uniformity of field size. The dimensions of fields used within the professional competition, the Australian Football League (AFL) vary from 175 m in length and 145 m in width (University of Tasmania Stadium) to 155 m by 136 m (Sydney Cricket Ground).
The average length and width of AFL grounds are 163.6 ± 5.9 m and 132.1 ± 6.9 m, respectively. One AFL field (Marvel Stadium) is indoors. Collectively, field size and stadia constrain the type of tracking systems used. In Australian football, GPS is commonly utilised during matches and training [109,110,111]. Given their suitability across outdoor and indoor stadia, inertial sensors including accelerometers, are also used [112]. Only recently have LPS been utilised during elite competition [113].
Using optical tracking is unsuitable for this sport, given the vast ground sizes that require a large number of cameras be used [114]. Athlete tracking systems are therefore, largely confined to accelerometers, GPS and LPS, and their derived metrics. The selection of which metrics to use, for the purpose of profiling Australian football training and match play, from these different systems is an important consideration.

The physical characteristics of these athletes is complex, part of interacting sub-systems and often reactive to a stimulus, including the ball, umpires, opponents or teammates. Understanding how these stimuli impact physical output is useful, to decide which metrics are meaningful. Features including anthropometric (e.g., height) and physiological (e.g., aerobic capacity) may impact external load. For example, aerobic fitness has a large effect on relative total and HSR distances covered during AFL matches [109].
Rucks in Australian football are typically taller than their teammates but cover up to 45% less distance at high-speed [109]. Environmental factors also impact metrics obtained. These results demonstrate that sport scientists should be mindful of the performer constraints during training and matches, which can impact the metrics.
A number of contextual factors influence the external load of Australian football athletes during training and matches. The number of rotations, margin, opposition quality and stoppages all impact the direction and magnitude of physical output in men’s matches [109].
In women’s matches, physical output is influenced by on-field rotation stint, opposition quality and margin [115]. Other contextual factors, including stoppages or brief breaks in play, also impact Australian football athlete external load. In elite men’s matches, increased stoppages result in less relative total distance covered [116]. Sport scientists should therefore be mindful of these contextual factors when analysing men's and women’s tracking data.
The relationship between physical and skilled characteristics has been examined in Australian football, in an attempt to give further context to physical metrics. Trivial and weak relationships exist between aggregated physical (e.g., absolute total high-intensity running) and skilled (number of involvements, including handballs and tackles) characteristics, when analysed via generalised linear models and conditional inference trees [113, 116]. Linear mixed models had low explanatory power whilst the conditional inference trees also had poor accuracy [113]. This is likely due to subtle changes in athlete physical and skilled output not detected in aggregate parameters. Moving averages have been utilised in Australian football, with men’s match intensities peaking at 223 ± 35 m.min across one-minute moving averages [117]. However, time-series analysis as described in 3.6.3 above, removes the need for manually selecting pre-defined time windows and can utilise the mean and variance of a metric. Athlete velocity data can then be examined, without having to rely on fixed duration windows, allowing for the detection of precisely when a peak match intensity occurs at a specific point in time [73]. By utilising time series and data mining techniques, sport scientists can therefore delve beyond aggregate parameters and extract features from raw GPS or LPS data. The specificity of Australian football training drills to matches could be examined by visualising the distribution of features from raw velocity traces, identifying when players obtain match intensities and how often this happens.
Given the abundant data available from athlete tracking systems and the dynamic, non-linear nature of the sport, sport scientists should look to move beyond reporting aggregate parameters, including total distance covered per drill, on-field rotation, quarter or match. Instead, sport scientists could utilise the raw velocity (or accelerometer) trace data to identify where, when and how Australian football athletes’ external load alters as a function of time.
When combined with an underlying theoretical framework, for example ecological dynamics [118], physical and skilled characteristics could together be analysed to potentially provide rich insights into Australian football training and matches.
Basketball
While there are data describing physical characteristics from different basketball leagues [119], the description of external load at the highest professional level (NBA), is limited [62, 120].
Game positional data is only accessible through the NBA’s official optical tracking provider, Second Spectrum (Los Angeles, U.S), and there are strict rules for the use of data for publication [62]. Commonly, other tracking systems are used during practices (those pre-approved by the NBA and the National Basketball Players Association), which implies a lack of homogeneity and compromises the ability of practitioners to build complete external load profiles across practice and competition [121]. As such, basketball sport scientists, performance and medical staff face numerous challenges on a day-to-day basis when it comes to using tracking systems and how to best use the information.

Basketball is an intermittent sport that, due to the court dimensions, number of players, and the rules [e.g., ball possession time (24 s)], requires the player to perform repeated high-intensity actions, such as rapid changes of direction and cutting actions, changes of speed in short distances, contacts (e.g., post-ups, screens, box-out), or run-to-jump actions, occurring between different locomotor demands (e.g., standing, walking, running, sprinting).
Likely heavily influenced by pre-existing research from other team sports, the most common tracking metrics studied in basketball have been total distance, relative distance (distance/duration), distance and/or time in speed zones (total, relative and percentages), high-intensity actions (usually referred as distance, time and/or counts of accelerations, decelerations, jumps) and peak velocity [119, 122].
Moreover, as in other team sports, the analysis of describing the most demanding scenarios, both through discreet or fixed-length time epochs and rolling average time epochs, is emerging [86]. However, the mentioned influence from other team sports reflects a certain lack of critical thinking in the analysis of basketball specifically.

High-speed, very high-speed running and sprinting distance are commonly reported at > 10 km.h−1, 18 km.h−1 [123], and > 24 km.h−1 [86, 122], respectively, in the literature; whereas, top speed reached by players reported in the literature is ~ 20 km.h−1 [119, 124]. However, different results in peak speeds have been shown at the elite level (e.g., NBA; unpublished data). Based on the limitation of court size and the subsequent shorter lengths of explosive efforts in basketball, practitioners should reconsider the selection of peak speed as a key metric for planning and/or monitoring in the decision-making processes. The lack of consensus, and the actual requirements of distances at different intensities, requires that the practitioners consider reviewing speed thresholds for sprinting and high- and very-high speed running in basketball, independently of references from other team sports.
Data mining techniques have been used to determine sport-specific thresholds, including fitting Gaussian curves [125], k-means clustering [126], and spectral clustering [127]. Such methods warrant consideration in basketball. Given the difference in the size of the playing area, it is likely that speed thresholds lower than other sports may be more suitable for analysing tracking data in the context of basketball.
Measures of velocity change (i.e., accelerations and decelerations) are other commonly used metrics, however, there is a lack of clarification and consensus across different tracking systems and manufacturers on how signals are filtered, calculations performed, or which are the suitable thresholds for this sport.
Regarding the latter, thresholds for LPS vary from < > 2 m.s−2 [86, 123], while research utilising IMU has used < > 3 and 3.5 m.s−2 for total and ‘at high-intensity’, respectively [119]. Similarly, there are differences across tracking systems as to whether acceleration and deceleration data are reported in counts, distances or time spent changing velocity. Alternatively, a simple method for averaging the acceleration and/or deceleration profile of a team sport has been proposed to overcome issues with using predefined thresholds with time-series data [128].

While this analysis was conducted on rugby league athletes, the authors discuss the importance of such movements to physical preparation and performance across a variety of team sports. While sport-specific research should be undertaken for basketball, given the court size, the nature of the rapid movements required and the importance of actions such as turnovers, cuts, close outs, or defensive shuffles, it appears these movements are vital for managing injury risk, planning and monitoring the training process, and quantifying competition characteristics. Which calculation to use will depend upon the use of the information by the practitioner; for example, the summated acceleration profile may be most relevant for description and monitoring; whereas, the count and distance covered accelerating may be useful in programming individual workouts in a rehabilitation process.
Quantifying overall external load using accelerometery technology has been become a key metric in basketball. Many manufacturers have their own version of accelerometer-derived load, although PlayerLoad™ may be the original and the most commonly used [7].
It is recommended that practitioners seek to understand how manufacturer-specific “load” metrics are calculated, not only in basketball but all sports using this metric, since the measurement, filtering processes, and threshold rules differ. For example, some manufacturers calculate “load” from three-dimensional accelerometery data, while others use two-dimensional LPS for the calculation.
Additionally, Schelling and Torres (2016) showed that constraints such as number of players, opponents, and court dimensions (i.e., half-, full-court) influence the external load [124]. Such studies are relevant for the practitioners to understand how the manipulation of constraints affect external load. Another pertinent aspect in basketball is the impact of the vertical load (z-axis) in the total count of ‘load’. The nature of this sport implies vertical actions (e.g., shooting, blocks), an aspect that has not been commonly reported in the literature, probably due to the lack of studies validating the quantification of jumps (and landing impact) across different tracking systems.
The evolution of tracking systems and machine learning techniques is allowing greater precision in the detection of basketball-specific movements. At present, technical aspects such as types of shots (e.g., driving layup or floater, pull-up jumper, step back, catch and shoot), picks, posts, isolations, off ball screens, among others, are recorded during matches with optical tracking. This, in combination with the metrics quantifying physical characteristics, can become a powerful tool for the generation of new and powerful insights in the description, planning and monitoring of external load in basketball.
Ice Hockey
Ice hockey is an intermittent, collision sport played on ice, characterised by high-intensity bouts of skating with rapid changes in speed and direction [129] and high technical demands, such as puck control, evading defenders, and body checking [130]. Players rotate on and off the rink in shifts, each lasting approximately 30 to 80 s, generally between 20 and 35 times across 60 min of game time [131].
At the highest professional level, the National Hockey League (NHL), the 82-game regular season is played with a game approximately every 2.25 days, prior to a post-season that can include an additional 28 games over 60 days [132]. Due to shift rotations, there is a wide range of individual game-time per player, with the total time on ice potentially varying from approximately 5 to 28 min for skaters (excludes Goaltenders).
Given this variation in game participation, compounded by the rate of competition, monitoring individual external load with a team is a worthwhile application of athlete tracking.

In order to monitor external load, tracking technology should be validated for the distinctive requirements of this sport. Notably, describing the unique biomechanical challenges of ice-skating reveals different characteristics to running [132].
Recent research has deemed an accelerometer-derived measure a reliable quantification of on-ice external load in a closed-roof hockey arena [133]. This measure can also reliably distinguish between certain ice hockey-specific movements including: acceleration, top speed, shooting, and repeated shift timing [133].
Describing external load, stratified into sport-specific categories and/or metrics, can further the understanding of technical and physical characteristics of training and competition. However, such microsensor technology may not be permitted in official competition and therefore, practitioners may be required to integrate such systems from the training environment with the different solutions permitted in competition.
Describing the high-intensity characteristics of skating with validated tracking technology is useful for the physical preparation of such athletes.
One study of 36 NHL players demonstrated an average of seven high-intensity bouts per minute required, with high-intensity (> 17 km.h−1) skating accounting for approximately 45% of total skating distance [131]. However, this distribution of skating intensity is different according to position. Defensemen and forwards accumulate a similar distance across a game but in a different manner; with defensemen skating significantly higher distances at lower velocity skating speeds and forwards covering more in higher velocity bands [131, 134, 135].
Given these positional differences, there is opportunity for tracking data to assist with planning appropriate training drills and sessions, both on a positional and individual level. The selection of suitable temporal durations for analysis and in turn, planning, should be considered by the practitioner based on training objectives. While game-time is structured by shifts with varying work-to-rest ratios, training drills may at times be more continuous in nature with all skaters participating on the ice. This warrants a critical appraisal to consider the most appropriate time-series analysis. For instance, given a forward could spend ~ 22.7 s of a shift in maximal or near-maximal skating [135], a similar time epoch (notably less than one minute) may be used to better understand skating intensity. In addition to understanding the intensity across positions, there is also a “special teams” component in ice hockey with “power play” and “penalty kill” periods. These passages may have implications for physical preparation, given the difference in the number of skaters permitted on the ice.

Using the playing environment to assess fitness parameters, rather than requiring additional time for isolated testing, is an appealing solution that tracking technology may assist with. Positioning systems may be capable of measuring on-ice sprint times in place of timing gates, although the context of the sprint should be considered, with the duration and movement complexity influencing the reliability of the measure [136]. The ability to repeatedly produce power is important to success and tracking systems may be able to objectively capture this ability [137]. This may be particularly valuable given that similar off-ice (i.e. land-based) measures do not necessarily relate to on-ice performance [137].
Tracking systems are still a relatively recent addition to ice hockey, with competition player and puck training introduced to the NHL in the 2019–20 regular season [138]. As such, there may currently be a paucity of tracking research within this sport, but numerous potential avenues to explore going forward. These include; the indication of fatigue based on drop-off in tracking outputs [136], assessing team pace of play using spatio-temporal possession data [32], quantifying the unique characteristics of the Goaltending position, and continuing to describe the characteristics of the game across different competitions, age groups, and genders.
Rugby Codes
All three rugby codes (league, union and sevens) are played on the same field dimensions and are characterised as high-intensity intermittent contact sports [148]. Yet despite these similarities, distinct differences exist between codes. Rugby union and sevens are played under similar laws, with different playing numbers (15 vs. 7), whereas rugby league is played with 13 players per team and extensively different laws [148]. The different laws and playing numbers of the rugby codes result in unique characteristics that should be considered by practitioners when determining the use of tracking systems data in each code. Here we will focus on some key considerations for rugby league.

Rugby League
Games of rugby league are played over two 30 to 40 min halves (depending on the level of competition), separated by a 10-min rest interval. At the professional level players cover between ~ 5367 to 7064 m, with ~ 335 to 563 m HSR distance, whilst also carrying out ~ 21 to 34 collisions, depending on playing position, within a match [149].
Given these physical characteristics, and specifically the associated physiological, biomechanical, and energetic cost of such contact elements on players [1], quantifying both locomotor and contact demands as part of the external load is vital.
Following the validation of a collision detection algorithm [150], the use of tracking systems data to quantify collisions has increased [151]. Hulin et al. (2017) found Catapult Optimeye S5 devices to be sensitive (97.6 ± 1.5%) to detecting collisions, and the overall accuracy to increase when low intensity (< 1 PlayerLoad™ AU) and short duration (< 1 s) collisions are removed [150]).
The use of tracking systems to detect collisions in rugby league enhances the ability to consider the locomotor and collision characteristics concurrently as opposed to separate entities [152].
For example, when quantifying and monitoring the ‘peak demands’ of rugby league competition, practitioners should consider: (1) the concurrent collision count, during the duration specific peak locomotive periods, and (2) the concurrent average running speed of the duration of the specific peak collision periods, to appropriately prepare players for the periods of competition.

Due to the collision nature of the sport, and the spatial confinements, players regularly accelerate and decelerate at high intensities; given the metabolic cost of these movements [128], it is important that they are also quantified and monitored. A range of acceleration metrics are utilised in rugby league, with average absolute acceleration becoming increasingly popular, especially for the analysis of the peak characteristics [82, 128]. This is an important trend given that acceleration has been shown to occur separately to peak periods of speed and yet, are equally important to the match outcome [81].
The use of PlayerLoad™, and its variants, has also been proposed to capture the acceleration, deceleration and change-of-direction, as well as the contact load [150] and are widely used in practice [16, 153].
Interestingly, the variant capturing the slow component (< 2 m/s) of PlayerLoad™, known as PlayerLoad™ Slow, has been used in rugby codes as a measure of sport-specific low-speed activity (e.g., rucking) [154]. Such accelerometry-derived metrics are also useful to capture external load in indoor training environments, given it is common practice for rugby league teams to carry out contact training in specific ‘padded’ rooms, and GPS derived acceleration metrics cannot be used in such environments.

Additionally, the unique technical and tactical requirements of the different positions within a rugby league team [155] result in differences in the physical characteristics of match-play. A main difference between positions is in the playing time of the match; forwards have lower playing times than backs [149, 156], which consequently influences the physical characteristics and should be taken into consideration.
Backs are reported to cover greater total distance than forwards [152], however studies report no differences in the average running speed of match-play, given the differences in playing time between positions [156, 157].
Therefore, practitioners are encouraged to not only utilise total distances, but also consider the intensity of the work given the differing playing time, via analysis of the average running speeds of match-play and the peak characteristics for position specific training practices. Importantly, differences in HSR, very HSR, and collisions are present between positions. Forwards cover less HSR distance compared to adjustable and backs, but carry out more collisions [149]. As such, tracking metrics may therefore be of differing value to practitioners when seeking to monitor the external load, and subsequent dose–response, across positions.
Finally, the tactical characteristics of rugby league should be considered alongside the physical, to enhance the application of tracking systems data and aid in training practices. Whilst competition is 80-min in duration, the match can be broken up into distinct phases of play given the rule of the set of six tackles: attack, defence and the attack-defence transition, as well as ball-in-play periods. By considering the physical characteristics within these periods of play, practitioners can work with coaches when planning and evaluating technical-tactical training. Distinct locomotor characteristics exist during attacking and defending phases, with greater average running speeds during defense, but greater HSR distance per minute during attack [74].
Further positional differences are likely due to the unique positional requirements such as ‘backs’ leading the kick chase or challenging for the ball during the attack-defence transition. Therefore, practitioners working with tracking systems data in rugby league should consider the nature of the sport (e.g., contact) and positional differences, alongside the tactical characteristics when collecting, analysing and interpreting data.
Soccer (Association Football)
Soccer is an intermittent field sport played by two teams of 11 players (10 outfield plus a goalkeeper) over two continuous 45-min halves, separated by a 15-min half time period [158]. The sport may be viewed as an early adopter of tracking systems, with much of the early research conducted in the 1990s stemming from optical tracking (predominantly semi-automated camera systems) and GPS use, in competition and training environments respectively, in the men’s professional game [158].
Despite being permitted in professional competition from 2015, many teams prefer to restrict GPS use to training only, potentially due to the less invasive nature of optical tracking. Thus, practitioners in these environments often face the challenge of integrating tracking data in order to consistently describe, plan, and monitor across the season. While integrative equations have been proposed, these are tracking system-specific, as well as dependent on the pitch size of the data collection [64].

Physical competition characteristics vary by playing position, depending on a number of situational factors, including tactical decisions, team formation, opponents style of play and level of competition [159, 160].
Total distance during a professional men’s match ranges from 10 to 12 km, with central midfielders covering the highest distance (11,885 m) while central defenders and strikers cover the lowest (10,671 m and 10,790 m, respectively) [161]. High-speed running (> 5.5 m.s) constitutes on average 12% of the total distance, however wide players are seen to cover a greater contribution of their total distance at high speeds [162, 163].
Similarly, wide players compared to central also produce the highest acceleration efforts, which is important due to the greater energetic demand of these movements [164].
The unique demands of the goalkeeping position result in 50% less total distance than outfield athletes (4–6 km), with 98% of match time spent in low intensity movement [165].
However, tracking systems have recently aimed to quantify goalkeeper-specific movement demands that include the number of dives, jumps, and overall forward and lateral explosive movements.
 - Catapult")
While absolute totals are necessary to describe the sport’s characteristics and monitor individual external load, practitioners are encouraged to think beyond absolute values to help guide physical preparation. The most simplistic use of relative (per minute) metrics enables identification of athletes' ‘pacing strategies’ [70]. For example, elite outfield male soccer players will range between 102 and 118 m/min depending on playing position [166]. Similarly, Fereday and colleagues (2020) identified the relative total distance between 120 and 190 m/min across a range of rolling average durations in professional male soccer players [90].
Rolling averages have been suggested as a superior analysis method compared to discrete 5–15 min epochs, due to a 12–25% underestimation in peak running demands [87]. Utilising peak locomotor demands to design position-specific training drills is common in applied soccer practice in an attempt to simulate game intensity [18].
However, concern has been raised over the validity of this concept, given that peak demands do not occur concurrently across metrics and players [94]. Practitioners are therefore reminded that the training process is complex and no single metric or calculation can surmise the external load an athlete is subjected to.
Drills in soccer are often manipulated in their design via field size, the number of players, or work-to-rest ratios, in order to elicit particular intensities. Practitioners using tracking systems in soccer can analyse the data to quantify the effects of such manipulation.
For instance, larger pitch size provide greater opportunity to sprint whereas, smaller pitch sizes may allow less exposure to high velocities but greater exposure to changes of direction, accelerations and decelerations [5]. In particular, small-sided games have garnered popularity as a training methodology in soccer, however they should be combined with other forms of drills due to limitations on reaching higher velocities.
High-speed exposure has been particularly highlighted as important for performance and injury risk perspective in soccer and therefore, many practitioners use the objective characteristics of soccer drills in comparison to competition characteristics to monitor athlete speed exposure over time [167]. However, despite the widespread adoption of regular high-speed exposure in practice, along with experts' opinion behind the concept [168], further work is required to establish stronger evidence in support of injury protection properties against regular high-speed exposure.
While this focus on quantifying and planning training drill design from a physical perspective is important, the technical and tactical components of soccer are also key contributors to success.
Therefore, coaches and practitioners strive to combine physical preparation with the tactical element. One method, tactical periodization, has become a popular training strategy [169]. This methodology stresses different physical and tactical elements in turn across the microcycle, whereby the main focus is soccer-specific training [170].
Furthermore, the coach’s style of play heavily influences physical characteristics in soccer, as in other team sports, with tactical periodization assisting in training exercise selection that represent the specific coach’s principles of play [170]. With many professional leagues competing multiple times a week, along with congested schedules at other levels of play, the taxing schedule adds an element of complexity regarding preparation and recovery. As such, combining physical and tactical goals into training drills and sessions provides a time-efficient approach that tracking systems can support.

While soccer research has historically focused on male athletes, there has recently been an increase in the women’s game [171]. Whilst the volume and intensity of total distance in the women is similar to that of males (8–11 km total; 108–119 m/min) [171,172,173], male players perform on average 30% more high-intensity movements during matches [171].
Therefore, to ensure appropriate application of tracking data to inform training and match preparation, an understanding of the physical characteristics specific to the female athletes is required. Particularly important to practitioners working with tracking data in women’s soccer is the consideration of suitable speed thresholds, given that most research has been conducted on men.
A Gaussian curve fitting approach was used with instantaneous velocity data from women’s soccer and other team sports, with the intersections between curves used to determine sport-specific speed thresholds [125]. However, concerns have been raised, including the appropriateness of the technique itself—as there is no evidence to suggest that the velocities within each zone follow a Gaussian distribution—as well as the dataset used, which was not from an elite female population [127].
Consequently, another group used the spectral clustering technique on a dataset from 27 female players across 52 international matches, which determined thresholds of 12.5, 19.0, and 22.5 km/h most suitable to denote high-speed, very-high-speed, and sprint categories, respectively, for elite women’s soccer [127].
Outdoor GPS market is dominated by some players like Catapult, and STATSports
In the GPS outdoor market, Catapult and STATSports are dominating. In fact, according to Upside Global’s internal data, Catapult and STATSports currently capture 50%+ of the GPS outdoor market. For example, Catapult has nearly 3000 customers today. In terms of brand recognition, both GPS vendors are top of mind among teams and leagues. However we are starting to get a sense, based on our conversations with pro teams, that many teams feel that those dominant players, especially Catapult, are a bit too expensive. This means that there is an opportunity for the emerging players to disrupt this market.
Emergence of smaller low cost players with good GPS accuracy and focusing on lower level leagues (SPT, McLloyd..)
Over the past few years we have seen the emergence of emerging GPS vendors which offer low cost GPS systems with good GPS accuracy. Unlike Catapult or STATSPorts which primarily focus on the world of elite sports, McLloyd and SPT essentially focus on High school, college teams as well as private coaches. Their GPS products are typically available for less than $5K per year (for 10 units) with payment flexibility and short term contracts. We expect those emerging players to continue to disrupt and gain traction at the lower end of the market in the coming years.
M&A activities are accelerating
In recent years the phenomenon of consolidation has accelerated in the GPS outdoor market. For example, Catapult acquired two startups. In 2020, Catapult acquired a subscription online sport learning platform, Science for Sport. Then last year, Catapult Catapult Sports bought SBG Sports Software (SBG), a global leader in video and data analysis to elite sports teams and motorsports. Through these acquisitions, Catapult was able to acquire new engineering talent, and new customers. But more importantly, the company was able to enhance its product offering in order to maintain its dominance. In 2021 Demcon acquired JOHAN Sports.

Picture: JOHAN Sports / Demcon
44% of athletic trainers plan to invest in GPS systems, according to the 2020 Upside Global survey
As shown in the graph below, 44% of the athletic trainers we surveyed last year are planning to invest in GPS systems in the future. This compares to 48% of the athletic trainers looking to invest in sleep trackers in the future.44% of them are also planning to invest in neurotech & mental health devices in the future. This does not come as a surprise as being on quarantine likely affected some players mentally and trainers want to make sure that they can address any mental issues moving forward. 32% of them are also planning to invest in HR monitors and video analysis systems. 32% of the athletic trainers are also looking to invest in temperature sensing & screening solutions.
Hydration/electrolyte monitoring solutions also gathered a lot of interest with 24% of the respondents indicating their plan to buy hydration/electrolyte monitoring solutions. Lastly, 16% of athletic trainers also indicated their plan to invest in connected fitness (Peloton, Tonal..) in the future.
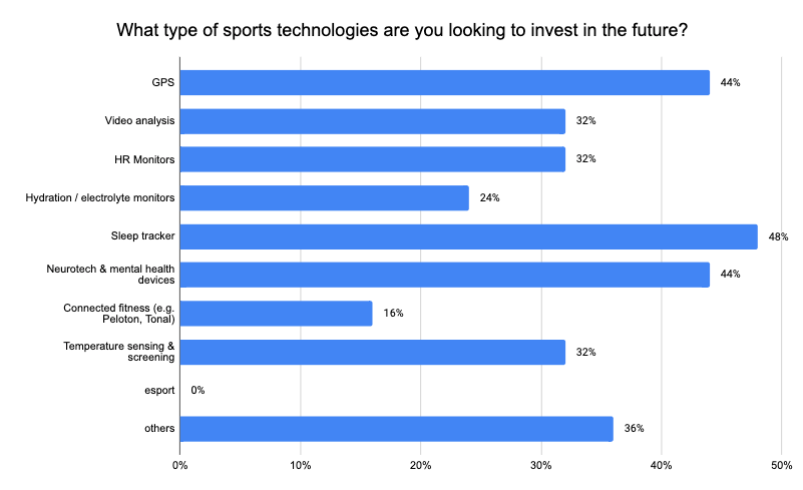
Source: Upside 2020 Top Coaches Sports Tech Budget Survey Results, Confidential, April 2020.
Upside GPS vendor survey: Catapult and STATSports captured nearly 50% of Mindshare.
Back in 2022, we surveyed 82 pro teams and leagues to assess their use of GPS monitoring technology and their perceptions and sentiments on the vendors involved in the market.
We surveyed teams from the NBA, NHL, NFL, MLS, MLB, Premier League, Ligue 1, Swiss soccer league, Turkish soccer league, South American soccer, NCAA, Pro tennis, pro rugby, and others, to assess the performance and share of mind of key GPS vendors, including Catapult, STATSports, Polar, McLloyd, SPT, WIMU, Kinexon, Titan, ASI, Johan Sports, Inmotion, Q-Track, Playmaker. Note: Johan Sports, Playmaker, Inmotion, Titan & Q-Track, and others. If you want to buy our full GPS vendor survey report click on the button below:

Here are some of highlights of the 2022 Upside GPS vendors survey:
82 pro teams and leagues (MLS, European soccer, South American soccer, NCAA, Pro tennis, pro rugby, etc.) responded to our survey.
60% of teams surveyed were soccer teams in EMEA and NA.
Catapult and STATSports captured nearly 50% of Mindshare.
74% of the teams surveyed plan to renew their current GPS systems.

Source: Upside Global, Confidential, November 2021.


Source: Upside Global GPS vendor survey, Confidential, April 2022.
Want to get unbiased team data on GPS vendors (Catapult, STATSports, WIMU..)? Check out our Upside Tech scouting platform
If you are a team and want to get unbiased team data on GPS vendors (Catapult, STATSports, WIMU....)? Please check out our new Upside Tech Scouting platform, the world’s first platform providing granular anonymized team data on specific teams (NBA, NFL, MLB, NCAA, Premier League, Laliga, Ligue 1, Bundesliga, national teams, Olympic teams, pro rugby, pro tennis..). For each team profile, users can see critical information provided by teams such as their annual sports performance budget, the GPS vendor(s) that they are currently using, their rating per vendors and the price range that they are paying for each vendor. Now keep in mind that each team profile has been anonymized as we take data privacy of teams very seriously.
Here is a video explaining how the platform works with video testimonials from teams (NBA, MLS, Premier league..) and vendors.
As illustrated below, users can search for team profiles in specific leagues (NBA, NFL, MLB, NCAA, MLB, Premier League, pro rugby, pro tennis..), sports types (soccer, hockey, basketball, baseball…), geographical area, and budget size, and using specific GPS vendors (Catapult, STATSports, Polar, McLloyd, SPT, WIMU..). For each team profile users can see what their annual sports performance budget is, which GPS vendors they are currently using, how they rated those vendors and the price range that they are paying for each technologies.

As we mentioned earlier, each team profile has been anonymized as we take data privacy of teams very seriously. This is why we only show the league logo (NBA, MLB, NFL, NCAA..) under each team profile. We do not show the specific team logo under each team profile.
As shown in the picture below, teams can also search for complete profiles of GPS vendors with critical information (product info, contact information, customers by leagues, survey data..).

To learn more about our new Upside tech scouting platform, see a live demo, get pricing information and subscribe to our new Tech scouting platform contact us at julien@sportscouncilsv.com or click on the button below.
Discrepancy in GPS accuracy between various vendors
Several studies have shown that there are discrepancies between GPS systems in terms of GPS accuracy. The most common factors affecting GPS accuracy include clock errors, ephemeris errors, atmospheric delays, multipathing and satellite geometry.
Remote monitoring, and mesh network driving adoption of smaller GPS vendors
In the outdoor GPS market, we are starting to see a number of smaller GPS vendors offering value added features and capabilities such as remote monitoring, and mesh network. This is the case of GPS vendors such as McLloyd. In our view, this is a nice way to differentiate their offering. Of note, remote monitoring is interesting especially in the context of COVID-19 where coaches are oftentimes trying to limit contacts with players. Creating a GPS system based on a mesh network is another great way to improve the accuracy of GPS measurements. In the future we expect more GPS vendors focusing on value added features in order to further gain market share.
GPS systems integrating more biosensing capabilities such as HR. Hydration measurement is next?
Over the past few years, we have also seen a number of GPS vendors offering GPS systems with biosensing capabilities such as HR measurement. This is the case of GPS vendors such as Polar. In the future we expect GPS vendors to go one step further and add new biosensing capabilities such as hydration, lactate, electrolyte, measurement and HRV sensing. It only makes sense to do so as it would allow teams to see the correlation between load and biometric data in order to better assess the health of players and prevent injuries.
Video analysis is becoming another great way for GPS vendors to differentiate
A growing number of GPS vendors also offer video analysis as it is a nice complement to GPS systems. The idea there is that you can also overlay the GPS data on top of the video analysis systems. Of note, this is partially the reason why market leader Catapult bought SBG a few years ago in order to remain competitive. We expect more GPS vendors to follow suit and offer video analysis in the future as a way to be on par with the competition and enhance their GPS offering.
3D/VR/AR based GPS system, another emerging trend among GPS vendors
Due to the growing adoption of VR solutions and VR headsets (Oculus Quest, PSV4..), a number of GPS vendors have started to add VR/3D capabilities to their GPS offering. For example, McLloyd built a 3D/VR/AR based GPS system allowing sports organizations to provide GPS data in 3D, AR, or VR to their fans. By doing so it helps enhance the fans' experience. It also helps increase fan engagement. We expert other GPS vendors to offer similar capabilities in the future.
The outdoor GPS market ecosystem: From GPS vendors to AMS:
The outdoor GPS market is comprised of the following subsegments:
GPS vendors: Typically those include companies manufacturing outdoor GPS systems. It includes vendors such as Catapult, STATSports, WIMU, McLloyd, SPT, Polar, Q-Track, Titan, Gpexe, VX Sport, FieldWiz/ASI, Johan Sports, among others.
AMS (Athlete Management Systems) vendors: These are typically player assessment & performance tools used by coaches in training and live games. Some of these tools track and analyze statistical (video analysis, distance ran..) and performance data (GPS, workload, HR, Motion, hydration, fatigue..) via the use of wearables and GPS trackers. Key players in the space include companies like Beyond Pulse, Myagonism, Sportgo, Apollo Youth, Kitman labs, Kinduct, Smartabase, Yguara, Pitz, Edge11.
GPS data accuracy software vendors: This includes vendors which provide special software enabling GPS providers to improve their GPS accuracy. This includes companies like ADI or Geoflex.
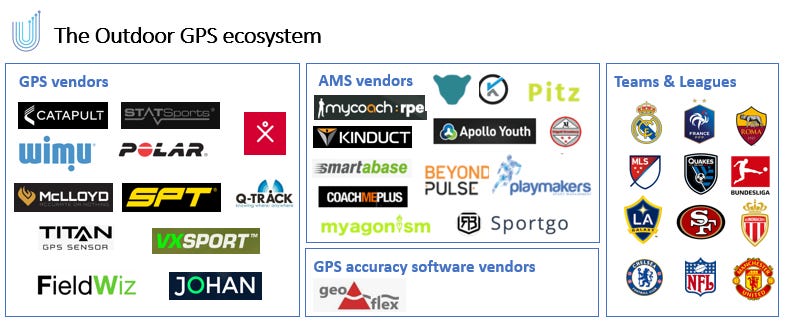
Source: Upside global Confidential, 2021
Now looking at the respective positioning of GPS vendors in terms of pricing strategy and targeted customers, we can categorize those GPS vendors in several groups:
GPS vendors primarily, which target elite teams and charge a premium ($20k-$40k per year) for their GPS solution: Those include companies such as Catapult, STATSports, Polar, WIMU, to name a few.
GPS vendors, which target low-mid level teams (High school, college teams, private coaches) and charge affordable pricing (<$5k for 10 units) for their GPS solution: Those include vendors such as McLloyd and SPT.

Source: Upside Global confidential, 2021
Also please note that on the chart above the purpose was not to show all the GPS vendors on the chart but to show some GPS vendors as a way to categorize GPS vendors.
Key outdoor GPS vendors
In the following section we will go over the main outdoor GPS vendors. Please keep in mind that this list is not meant to be exhaustive.
Catapult

Founded: 2006
HQ: Melbourne, Victoria, Australia
Amount money raised: N/A (Public company)
Website: https://www.catapultsports.com/
Investors: Catapult is funded by Aura Ventures. Catapult has acquired 4 organizations. Their most recent acquisition was SBG Sports Software on Jun 23, 2021.
Total employees: 474
Customers / partners: 2970 customers. Bayern Munich FC, LA Galaxy (MLS), Wales Rugby and NFL's Steelers, amongst others, use Catapult.
Company/product description: Catapult is a sports performance analytics company, listed on the Australian Stock Exchange, that provides performance technology to 2970 teams, across 39 sports, in 137 countries. The company is headquartered in Melbourne, Australia.
There are three physical products: Catapult Vector, the ClearSky T6 and Optimeye S5. Each of these pieces of hardware is worn by athletes to help track different elements of their performances.
ClearSky is a local positioning system (LPS) Catapult developed in conjunction with the Commonwealth Scientific and Industrial Research Organization (CSIRO) that delivers accurate positional and inertial data in varying environments.
Catapult also developed a goalkeeper monitor, the G5, which quantifies the direction and intensity of dives, jumps, accelerations/decelerations, changes of direction, repeat high intensity efforts, and time to recovery.
Through its acquisition of GPSports, XOS Digital, PlayerTek, SportsMedElite and Baseline Athlete Management Systems Catapult also offers video technology and GPS systems for semi-professional sports teams and amateur football players.
STATSports

Founded: 2007
HQ: Newry, Newry and Mourne, United Kingdom
Amount money raised: TBD
Website: https://statsports.com/
Investors: TBD
Total employees: 124
Customers / partners: 1000 customers (PSG, Tottenham Hotspurs,, Liverpool, Juventus, England National soccer team, US national soccer team..)
Company/product description: STATSports STATSports has grown from its humble origins in Ireland to be the world-leading provider of GPS player tracking and analysis equipment. They now have offices in Ireland, London, Chicago and Florida. The STATSports APEX/Viper System is a customer driven platform. The user-friendly interface was designed and shaped alongside some of the world’s top strength coaches, medics and sports coaches. It is the only system to offer sports specific software for Football, Basketball, American Football, Rugby and Athletics.
WIMU

Founded: 2008
HQ: Almeria, Andalucía (Spain)
Amount money raised: TBD
Website: https://www.wimu.es
Investors: FC Barcelona
Total employees: 29
Customers / partners: 400 customers (FC Barcelona, Real Madrid and the Spanish national team, Arsenal FC, Bundelsiga teams..)
Company/product description: WIMU is a Spanish GPS vendor. Its Spanish Elite Tracking System WIMU PRO is used by FC Barcelona, Real Madrid and the Spanish national team (amongst others). FIFA approved its GPS system for player tracking both indoor and outdoor.
Wireless wearable device with advanced sensors providing muscle oxygen levels, respiration and heart rate and presents all the data from compatible devices from one single platform.
McLloyd

Founded: 2013
HQ: Paris (France), US subsidiary in Miami, FL (USA)
Amount money raised: 2M€
Website: https://mclloyd.com/
Investors: TBD
Total employees: 15
Customers / partners:
« Sport Performance » : 100+ customers in Europe (Stade Rennais. Standard de Liege, Amien SC...), North America (Florida’s PSG academy , Miami city, House of Athletes & SD legion. Etc.).
« Racing Tracking & Broadcast major clients » : PMU, France Galop, Le Trot, 52 Super Series, Professional Triathlete Organisation (PTO)
McLloyd was born in 2013 in France. Based on the growing demand for performance optimization tools in sport and the limitations of existing equipment, McLloyd has set itself the goal of bringing a technological breakthrough in this area. After 3 years of R & D and several million euros invested, a first World Rugby Compliant system was launched in 2016, propelling McLloyd as the leading supplier of French professional rugby (TOP14 / ProD2). Then in 2017, McLloyd won the international PMU bidding competition for 42 companies and is now the official tracking system supplier for the french gallop and trotting races (6000 races/year). Thus was born the first centimetric GPS tracker in the world compatible with the constraints of sport and racing due to its size and weight. This range of products for Horse Racing led to a new generation of high-accuracy trackers now used also on sailing (52 Super Series) and Triathlon (Professional Triathlete Organization) races.
In 2018 McLloyd opened a subsidiary in Miami, and today addresses the European, Asian and American markets of tracking in professional sports and racing.
McLloyd’s goal for the next 24 months is to keep growing and hope to reach 100 clients by the end of the year. They will also adapt their racing tracker (HPv2) for sport performance purposes with a new packaged solution.
They would like to do more than just providing data. Using GPS it's a good step but knowing what to do with your data is the key in modern sport. They are trying to build a community of coaches that use their products and can exchange with other teams and staff.
They are known as a reference in matters of accuracy and robustness of the system but at the same time they have to remain affordable to be able to work with every team looking for performance.
SPT

Founded: 2015
HQ: Melbourne, Australia & Austin, Texas
Amount money raised: $8.5M
Website: www.sptgps.com
Investors: Family Offices, Elite Australian Athletes (Leyton Heywitt..)
Total employees: 10+
Customers / partners: 75,000 Users, 3,300 teams across 120 countries.
Company/product description: SPT is the Australian market leader in the prosumer space for wearable and performance analytics. Launching in the USA in 2018, SPT has also become one of the College and High School go to technology choices. It simplifies the complex and provides an easy-to-use system for those looking to adopt technology to improve their sporting programs without spending their whole budget.
SPT’s business model simplifies the path to success. It allows teams at all levels and individuals looking to improve the ability to partner with SPT and use our patented hardware and analytics program (GameTraka®). GameTraka® is a leading analytics platform that provides a simple system and allows for customisation and complexities our top organisations can upgrade to. Premium offerings for all teams at the flick of a switch provides in-depth analysis or simple analysis – depending on the level of your program.
SPT’s goal for the next 24 months is to become the market leader in the USA as they are currently in Australia. Their system has recently been wholly re-launched with an updated design and more specific features for the customer. They bring the complex and turn it into simple decision making and powerful outputs for all programs. Their Division 1 colleges, global, national programs, and smaller high school and club development teams all find massive value in the SPT system.
Polar

Founded: 1977
Amount money raised: TBD
Website: https://www.polar.com/
Investors: TBD
Total employees: 1200
Customers / partners: VFL Wolfsburg, South American soccer teams, Asian soccer teams, etc.
Company/product description: Polar is a manufacturer of sports training computers, particularly known for developing the world's first wireless HR monitor.
The company is based in Kempele, Finland and was founded in 1977. Polar has approximately 1,200 employees worldwide, it has 26 subsidiaries that supply over 35,000 retail outlets in more than 80 countries. Polar manufactures a range of heart rate monitoring devices and accessories for athletic training and fitness and also to measure HRV.
Designed for professional team sports, Polar Team Pro combines high-precision GPS-derived movement data, inertial sensor metrics and integrated heart rate monitoring into a mobile and easy-to-use wearable player tracking system.
Q-Track

Founded: 2002
HQ: Huntsville, Alabama, United States
Amount money raised: TBD
Website:https://q-track.com/sports-tracking/
Investors: TBD
Total employees: 7
Customers / partners: South American soccer teams, etc.
Q-Track is applying its precision indoor location technology to accurately and objectively measure athlete performance. The Sports Medicine Assessment Tool (SMAT) provides comprehensive kinematic and physiological data to trainers, coaching staff, and athletes alike. SMAT allows for a quantitative assessment of training intensity providing for maximum performance while minimizing injuries. The result is a better prepared more competitive team.
Titan

Founded: 2004
Amount money raised: TBD
Website: https://titangps.com/
Investors: TBD
Total employees: 54
Customers / partners: European soccer teams, etc.
Titan GPS design, develop, manufacture, and support end-to-end GPS location and fleet management telematics technology. Certified Tracking Solutions design, develop, manufacture, and support end-to-end GPS location and fleet management telematics technology under the brand name Titan GPS. Titan GPS is a trusted partner to thousands of fleet customers in the public sector, field service, winter maintenance, transportation, construction, transit, auto dealer, and OEMmarkets across North America, including particularly strong relationships with municipalities throughout Alberta.
Gpexe / Exelio

Founded: 2009
HQ: Udine, Italy
Amount money raised: TBD
Website: https://www.exelio.eu
Investors: TBD
Total employees: 18
Customers / partners: 150+ teams (AC Milan, Inter Milan, Sampdoria, AS Monaco, etc.)
Gpexe is a GPS system manufactured by Exelio. Gpexe is a tracking system for team sports performance analysis, working through a high sampling rate GPS receiver. The majority of the Italian Serie A teams, over 150 clubs and National Teams worldwide, use Gpexe.
Their strength in the market can be attributed by its 20 Hz device frequency, much higher frequency devices than that of most of its competitors. This is due to the fact that they only have one GPS reference (no Galileo, no glonass). Other GPS vendors are multiple constellations which is why they can only use a 10 Hz device frequency. With this high frequency GPEXE achieves a higher accuracy of information when tracking a player's changes in speed and direction, something a lot of providers struggle to do with lower frequencies.
VX Sports

Founded: 2007
HQ: Louisiana, USA
Amount money raised: TBD
Website: https://vxsport.com/
Investors: TBD
Total employees: 6
Customers / partners: NCAA teams.
VX Sport athlete monitoring products are used by world leading teams to drive performance decision-making. Only the VX System combines the tracking of physical and readiness data with simple planning tools that empower coaches to improve athlete performance. VX Sport provides the most accurate and affordable athlete monitoring solution.
FieldWiz / ASI

Founded: 2012
HQ: Lausanne (Switzerland)
Amount money raised: CHF655K
Website: https://www.asi.swiss
Investors: FieldWiz is funded by 2 investors. Business Angels Switzerland (BAS) and Foundation for Technological Innovation (FIT) are the most recent investors.
Total employees: 18
Customers / partners: Swiss soccer teams, Belgium soccer teams, FFR XIII, among others.
Based on the joint passion for sports and technology of its founders, Advanced Sport Instruments SA (FieldWiz) is specializing in the development of electronic performance and tracking solutions. At the core of the company is a team dedicated to reimagining how technology can be leveraged to improve the performance of elite athletes. Advanced Sport Instruments works with hundreds of organizations and brands around the world like nation winter sport federations, football club from Champions League level to ambitious amateur teams, motorbike racing and adventure sports solutions. The company was the first to obtain the FIFA IMS certification for its solutions.
Johan Sports

Founded: 2014
HQ: Noordwijk, Zuid-Holland, The Netherlands
Amount money raised: TBD
Website: https://www.johansports.com/
Investors: TBD
Total employees: 7
Customers / partners: South American soccer teams, etc.
JOHAN Sports offers an easy-to-use, affordable and practical performance tracking and analytics solution for field sports.
JOHAN serves field sport teams, both coaches, trainers, players and club management. They focus on teams with a medium to small staff, which generally have little to none scientific staff like data analysts and sports scientists. Although they provide all the raw data and statistics, most of their users need the relevant context of this data such that they can put it into practice. This way complex science and technology becomes available to every type and level of trainer.
Recommendations to teams and leagues looking to adopt an outdoor GPS solution
Here are some recommendations for teams or leagues looking to adopt a GPS solution:
Ask yourself some key questions and assess your ideal game style: Teams need to ask themselves some key questions before adopting a GPS solution.
“Take the time to ask key questions and assess your ideal game style, athlete makeup and squad goals. Ask how GPS data would inform this”, recommended Ben Sharpe, Product development manager at SPT, during an interview with Upside Global.
More precisely, teams could answer the following questions:
“Teams need to answer the following questions: Requirements of the GPS system in terms of quality/accuracy, software quality, the types of data needed, the number of GPS systems needed, the need to use live cardio or not, the type of GPS (indoor or outdoor) needed, the monthly budget. This will help the team determine which GPS system is the best fit for them”, explained Laurent Debrousse, the head of McLloyd North America, during an interview with Upside Global.
Adopt a GPS system that fits your actual needs: It is critical for teams to pick a GPS system to meet their needs.
“Consider your actual needs, some systems that require a large amount of staff hours may in fact carry too much functionality that does not get used. Ask your coaching staff what they need from a system”, recommended Ben Sharpe, Product development manager at SPT, during an interview with Upside Global.
Make sure to mix the GPS data with other data points to get a better picture of the athletes’ health: As we mentioned earlier, it is critical for teams to aggregate their GPS data and mix it with other types of biometric data such as HR, HRV, etc. By doing so, it will give the coach a better sense of the health of his/her players.
“Don't over complicate or over rely on one single metric or data point. Embed any technology as part of a holistic monitoring and performance tracking ecosystem’, recommended Ben Sharpe, Product development manager at SPT, during an interview with Upside Global.
Adopt a data visualization software in order to better visualize the GPS data: Many times GPS vendors do not offer good data visualization software as part of their GPS offering. This is why it is important for teams to adopt data visualization tools provided by companies such as Rock Daisy in order to help them better visualize the GPS data.
Adopt an injury prevention software in order to prevent injuries: Adopting an injury prevention software that will aggregate both the GPS data as well as other types of biometric data (HR, hydration, electrolyte, sleep data/HRV..) in order to fully assess the risk of injury per player, is absolutely critical. Injury prevention software such as Kitman Labs, use advanced algorithms which help identify patents, and baseline of each player, and therefore can identify when a player is at high risk of injuries based on increased load, increased body temperature, poor sleep quality, or other factors.
Adopt a GPS system that fits into your workflow: This is probably one of the most important points. Whatever GPS solution a team decides to adopt the GPS system needs to fit into the team’s workflow, meaning that it should not disrupt the routine of the athletic staff, players and make them less productive. Those GPS systems should be easy to use, intuitive, and easy for the players to wear. Overall, if a GPS system does not meet those criteria it is probably not a good fit for a team.
Make sure to have staff members (GPS analysts, sports scientists) that can manage your GPS systems on a daily basis: Teams also need to have a dedicated person on staff responsible for the GPS system. In some cases a GPS analyst would be required to analyze the GPS data if the GPS system does not provide good insights.
Focus on GPS vendors with great customer service: This is another key factor when buying a GPS system. It is important for the team to adopt a GPS system with great customer service. Some GPS vendors provide staff members who can go on the customer’s site in order to assist teams with any problems. Some GPS vendors even have the ability to build custom data to teams. These are the type of GPS vendors that teams need to work with when adopting a GPS system.
Focus on GPS vendors with remote monitoring: In the pandemic world that we are living in, it is also important for teams to work with GPS vendors who can provide remote monitoring, meaning the ability for coaches to remotely monitor their players. GPS vendors such as McLloyd offer such capability.
Focus on GPS vendors with affordable pricing without long term contracts: Oftentimes we hear from teams that they are locked into long term contracts by some GPS vendors. Therefore it is important for teams to look for GPS vendors that offer pricing flexibility (1 year contract or monthly payment) as well as affordable pricing options based on the teams’ needs. GPS vendors such as McLloyd fall into this category.
Focus on GPS vendors with value add services (AR/3D/MR..): As we mentioned before, working with a GPS vendor that can visualize the GPS data in AR/VR/3D in order to better understand and visualize the GPS data is critical as well. Companies such as McLloyd have such capability today.
Bottom line: Outdoor GPS systems have become a must have for sports such as soccer, or American football teams can choose from a wild variety of GPS vendors today. It is critical for sports teams to carefully assess those GPS vendors in terms of pricing, product quality, GPS accuracy, and vision of the management team, and other factors. Moving forward we expect M&A activities in the outdoor GPS market to accelerate. We also expect new emerging players to enter the market in order to disrupt the dominance of the incumbents. This will help fuel innovation in the GPS market which will be a win win situation for the teams and GPS vendors.
🔗 Upside Analysis: The NFT Sports Market: Key Players, Trends, Recommendations to Teams.
⭐ Upside Startup Spotlight: Neurocess
You can check out our Upside Global platform here to start accelerating your business