
📚 Upside Studies: (1) Basketball Study: Injury Incidence Rate (2) NHL Study: Injury Rates Increase During Olympics? (3) NFL Study: Spending on Star Players & Team Success in the NFL

🏀 Upside Study (1): Injury Incidence Rate According to Mechanism, Body Location, and Type in Basketball Players — A Systematic Review and Meta-Analysis
Authors: Emilija Stojanović, Aaron T. Scanlan, Dragan Radovanović, et al.
Published in: Sports Medicine, 2025
🔎 Introduction
Basketball is a high-intensity sport requiring repeated accelerations, jumps, rapid changes of direction, and constant player contact. These intense physical requirements place basketball athletes at heightened risk of injury, especially at elite and competitive levels. To inform injury prevention strategies, a detailed understanding of injury origins—how players are hurt, what body parts are affected, and what types of injuries occur—is essential.
Although individual epidemiological studies exist, the literature lacked a comprehensive meta-analysis quantifying injury incidence rates (IR) in basketball by injury mechanism (contact, non-contact, surface impact, etc.), body location (ankle, knee, head, etc.), and injury type (sprain, strain, concussion, fracture, etc.), while also comparing differences by sex, level of play, and competition vs practice exposure.
This study provides the largest and most up-to-date synthesis to date on how, where, and why basketball injuries occur, based on over 50,000 injuries recorded across more than 13 million exposures.
You can download the full PDF study by clicking on the link below:
🎯 Research Objective and Scope
The study aimed to systematically review and meta-analyze published basketball injury epidemiology data to:
Quantify injury incidence rates (IR) by mechanism
(e.g., player contact, ball contact, non-contact, overuse, equipment, etc.)Measure injury incidence by body location
(e.g., ankle, knee, head/face, shoulder, etc.)Classify injury incidence by type
(e.g., sprains, strains, fractures, concussions, contusions)Compare differences based on:
Player sex (male vs female)
Level of play (high school vs college vs professional)
Exposure setting (competition vs practice)
The goal was to identify the strongest patterns and risk factors that should shape future basketball injury prevention and performance support programs.
⚙️ Methodology
Study Design
A systematic review and meta-analysis following PRISMA guidelines.
Databases searched through October 2024 included:
PubMed
Google Scholar
MEDLINE
Inclusion Criteria
Studies were included if they:
Reported injuries in organized basketball practices or games
Included players aged ≥15 and classified Tier 3–5 (high school, collegiate, or professional)
Reported exposures in athlete-exposures (AEs) or exposure hours
Provided data on injury mechanism, location, or type
Dataset Overview
22 studies included
50,585 injuries
13,309,133 athlete exposures
375,620 exposure hours
Injury Categories Examined
Mechanism:
Player contact
Non-contact
Ball contact
Surface contact
Out-of-bounds contact
Equipment contact
Overuse
Unspecified
Body Regions:
Head/face/neck
Upper extremity
Trunk
Hip/groin/thigh
Knee
Lower leg
Ankle
Foot
Injury Types:
Ligament sprain
Muscle/tendon strain
Concussion
Contusion
Fracture
Dislocation/subluxation
Abrasion/laceration
Meta-analytic comparisons were conducted for:
Sex
Level of play (HS vs college)
Competition vs practice
📊 Key Findings
1️⃣ Mechanism: How Basketball Injuries Occur
Player contact was the No.1 injury cause, accounting for:
42.9% of all injuries
IR = 0.156 per 100 AEs
Non-contact mechanisms were second:
25.0% of injuries
IR = 0.093 per 100 AEs
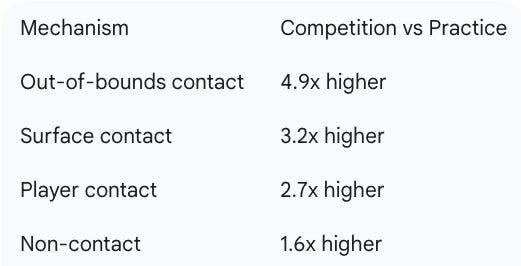
Competition significantly increased injury risk across nearly every mechanism:
Female athletes had significantly higher rates of ball contact injuries than males.
2️⃣ Body Location: Where Players Get Hurt
Lower-body injuries dominated:
61.7% of all basketball injuries occurred in the lower extremity
Ankle: 25.8% (IR = 0.075 per 100 AEs)
Knee: 15.5% (IR = 0.046 per 100 AEs)
Competition increased IR for nearly all body locations:
Knee: 2.8× higher
Ankle: 2.2× higher
Head/face: 3.2× higher
Female players had significantly higher IR for:
Knee injuries
Head and face injuries
Lower leg injuries
3️⃣ Injury Type: What Injuries Occur
The most common injury types were:
Competition increased injury incidence across most injury types:
Concussion: 3.5× higher in competition
Ligament sprain: 2.5× higher
Dislocation/subluxation: 2.8× higher
Female players had significantly higher rates of:
Knee sprains
Dislocations/subluxations
Concussions
⚠️ Limitations
Heterogeneity was high due to differences in:
Injury definitions
Reporting systems
Exposure measurements (AEs vs hours)
Limited reporting of non-time-loss injuries, meaning minor injuries may be underrepresented.
Most data derived from high school and college settings, with fewer studies on professional players.
Inconsistent injury definitions (e.g., how “overuse injury” was classified).
🧠 Implications for Practice
1️⃣ Basketball Needs Level-Specific Injury Prevention
Collegiate players consistently showed higher injury rates than high school athletes due to:
Higher workloads
More physical contacts
Greater match intensity
2️⃣ Lower Extremity Protection Is Priority
Given that ankle and knee injuries make up 41% of all injuries, teams should prioritize:
Neuromuscular and balance training
Screening for high-risk athletes
Appropriate bracing/taping (with individualized assessment)
3️⃣ Women’s Basketball Requires Targeted Support
Female athletes suffered higher rates of:
Knee injuries
Ball contact injuries
Concussions
Prevention programs should address:
Neck strength
Neuromuscular control
Landing mechanics
Structural anatomical risk factors
4️⃣ Competition Is the High-Risk Environment
Teams should increase:
Injury surveillance
Medical coverage
Sideline concussion checks
Game-specific prevention protocols
✅ Conclusion
This large-scale systematic review and meta-analysis confirms that:
The majority of basketball injuries result from player contact and non-contact biomechanical events.
Lower extremity injuries—especially ankle sprains and knee injuries—are the most prevalent.
Ligament sprains, muscle strains, concussions, and contusions represent the most common injury types.
Women sustain significantly higher rates of knee injuries, concussions, and ball-contact injuries.
Injury risk is consistently higher in competition than practice, especially at higher playing levels.
These findings support the need for smarter load management, better injury surveillance, stronger neuromuscular prevention programs, and tailored strategies for women and collegiate athletes.

🏒 Upside Study (2): Do NHL Injury Rates Increase During Winter Olympic Years?
Authors: Ibraheem Qureshi, Hans Drawbert, Minn H. Saing, and John T. Riehl
Published in: Orthopaedic Journal of Sports Medicine, 2025
🔎 Introduction
The National Hockey League (NHL) is unique among major professional sports leagues in that every four years, its regular season is interrupted to allow players to participate in the Winter Olympics. These tournaments occur mid-season, requiring extensive travel, condensed competition schedules, increased physical load, and the need to rapidly return to regular league play shortly thereafter.
Prior studies in other high-performance sports—such as domestic soccer leagues affected by the mid-season 2022 FIFA World Cup or the African Cup of Nations—have found that unusual degree of congestion and match intensity can increase injury risk. For the NHL, while analyses have examined post-Olympic performance/output changes among athletes and teams, comprehensive league-wide evidence quantifying whether player injuries actually increase during Olympic seasons has been limited.
This study provides one of the most detailed analyses to date, comparing NHL injury rates and patterns during Olympic years (2002, 2006, 2010, 2014) versus standard seasons between 2000 and 2023 to determine whether Olympic participation creates measurable additional injury burden for players and teams.
You can download the full PDF study by clicking on the link below:
🎯 Research Objective and Scope
The researchers designed the study to answer three main questions:
Do overall injury rates increase during seasons in which NHL players participate in the Olympics?
This includes the league as a whole, regardless of whether individual players were selected for Olympic rosters.Do certain categories of injuries (knee, muscle, shoulder, etc.) increase during Olympic years?
Within Olympic seasons, do Olympic participants experience different injury risks compared to non-participating NHL players?
To accomplish this, the authors compared:
Total number of injuries
Frequency of specific body-location injuries
Rates of multiple injuries per player
Average games missed due to injury
⚙️ Methodology
Dataset
The study retrospectively analyzed all NHL player injuries between 2000 and 2023, drawn from widely used public reporting databases, including:
TSN
CapFriendly
CBS Sports
SportsForecaster
These databases have been used in prior NHL injury research and record injuries severe enough to cause at least one missed official game.
Injury Seasons Compared
Olympic Years: 2002, 2006, 2010, and 2014
Non-Olympic Seasons: 20 remaining seasons between 2000–2023
Key Definitions
Injury: Any issue causing a player to miss at least one official NHL game.
Multiple Injuries: A player sustaining a second or subsequent injury in the same season.
Non-medical absences (suspensions, personal leave, tactical decisions, etc.) were excluded.
Data Collected
Total injuries per season
Injury distribution by position
Location/type of injury (e.g. knee, muscle, eye, ankle, etc.)
Mean games missed due to injury
Statistical Analysis
Group comparisons using t-tests and chi-squared tests
Logistic regression models adjusting for player position to determine whether Olympic seasons increased the odds of certain injury types
📊 Key Findings
1️⃣ Overall Injury Rates
No increase in total injuries during Olympic years

Difference was statistically non-significant (P = .94).
2️⃣ Injury Pattern Changes During Olympic Years
Although total injuries remained stable, several injury categories increased during Olympic seasons, even after adjusting for position:
Knee injuries
Odds Ratio (OR): 1.71
P < .001
Muscle injuries
OR: 1.65
P < .001
Foot & ankle injuries
OR: 1.49
P < .001
Arm & shoulder injuries
OR: 1.25
P = .001
Eye injuries
OR: 1.49
P = .029
In addition, multiple injuries per player were significantly more likely in Olympic years (OR = 1.12, P = .002).
Notably:
Defensemen and goaltenders showed a higher proportion of injuries during Olympic seasons compared to standard years.
Average games missed per injury slightly decreased during Olympic seasons (7.44 vs 8.23), possibly suggesting quicker returns to play despite the higher frequency of certain injury types.
3️⃣ Olympic Players vs Non-Olympic Players (Within Olympic Seasons)
When comparing only players within Olympic years:
No significant difference in overall injury rates:
GroupMean injuries per playerOlympic players1.194Non-Olympic NHL players1.486
(P = .18)
Olympic participants showed:
Higher odds of multiple injuries (OR = 1.23, P = .018)
Higher rates of chest/torso injury
Lower odds of foot/ankle and arm/shoulder injuries
Olympic athletes specifically showed more knee and muscle injuries in Olympic seasons compared to non-Olympic seasons (P = .005 and P = .001).
This mirrors trends observed in soccer World Cups and other mid-season international events, where high-load competitions contribute to soft-tissue injury spikes once athletes return to domestic schedule congestion.
⚠️ Limitations
The authors note several methodological constraints:
Injury reporting depended solely on public databases, meaning:
Minor injuries not causing missed games were likely omitted.
Some injury details may lack medical precision.
No granular match-level workload data (minutes played, shift counts, travel exposure, direct mechanisms).
Olympic participation archives missing 1998, meaning one year of eligibility was not captured.
Different tournament structures across sports (e.g. NHL halts season during Olympics but European soccer does not) complicate multi-sport comparisons.
🧠 Implications for Practice
1️⃣ Player Load Management Is Key
The study suggests that Olympic seasons do not inherently increase overall league injury burden, but they do intensify soft-tissue and joint injuries, especially:
Muscle strains
Knee injuries
This supports prioritizing:
Short-term load tapering before Olympic travel
Intensified monitoring weeks immediately after return
Increased training focus on recovery and tissue resilience
2️⃣ Defensemen and Goaltenders Require Specific Consideration
These positions saw a higher share of injuries during Olympic seasons, possibly due to:
Higher continuous workload demands
Less rotational substitution compared to forwards
Increased stress and exposure in international tournament play
3️⃣ Return-to-League Protocols Could Reduce Multiple Injuries
Because multiple injuries per season were more common in Olympic years, organizations could benefit from:
Structured re-entry guidelines
Player-specific post-Olympic conditioning plans
Reduced immediate workload ramps
✅ Conclusion
This comprehensive 23-year database review found that:
Olympic seasons do not increase total NHL injury rates, contradicting assumptions that mid-season international play automatically elevates league-wide injury risk.
However, certain injury categories—including muscle strains, knee injuries, and repeat injuries—occur more frequently during Olympic seasons, particularly in players who compete in the Olympics.
These results suggest that while the Olympic break does not harm the league at a macro level, individual players (especially Olympic participants) experience focused injury risks linked to soft-tissue overload and accelerated game cycles.
These insights can inform future NHL negotiating positions on Olympic participation as well as more proactive workload and recovery strategies for teams during Olympic years.

Upside NFL Study: Spending on Star Players & Team Success in the NFL
🏈 Introduction
Success in the National Football League (NFL) hinges not only on recruiting elite talent but on strategically allocating financial resources within a hard, league-wide salary cap. Unlike other professional sports systems that allow massive spending disparities, every NFL franchise operates under the same financial constraints, forcing general managers to decide how best to distribute payroll: concentrate spending on a few star players, or spread investments more widely across the roster.
For years, sport media and public perception have suggested that “superstar-driven teams win championships.” Quarterbacks, elite pass rushers, and marquee wide receivers regularly command record-breaking contracts, reinforcing the belief that paying top talent is the most reliable pathway to on-field dominance.
However, comparatively little empirical work has tested whether this belief is true at the league level—or whether certain spending strategies are more efficient, more predictive of wins, or more strongly associated with playoff and Super Bowl success.
This study, covering the 2011–2020 NFL seasons, uses a rigorous efficiency-based economic model to analyze how teams deploy payroll capital across their rosters and how these decisions relate to real competitive outcomes. It evaluates four key questions:
Do teams that spend heavily on a small number of stars actually perform better?
Are certain positions (especially quarterback or defense) better investments than others?
Can efficient spending—not just high spending—predict playoff advancement and championships?
What patterns differentiate consistently successful franchises from chronic under-performers?
Using robust Data Envelopment Analysis across ten full seasons and all 32 NFL franchises, the study provides one of the clearest quantitative examinations to date of whether it is truly “all about the stars”—or whether smarter, more balanced payroll management drives winning in the modern NFL.
You can download the full PDF study by clicking on the link below:
1. Context
Understanding how teams should distribute their salary cap is a critical strategy question in the NFL. Franchises operate under a hard, universally applied cap — forcing general managers to decide whether to:
Spend heavily on a few elites
Spread payroll across the roster
Prioritize certain position groups (offense, defense, QB)
This study uses 2011–2020 league data to evaluate which approaches are most payroll-efficient and how efficiency correlates with playoff and Super Bowl outcomes.
2. Objective
The purpose of the research is to examine:
Are NFL teams more successful when they invest heavily in star players, or when they spend their payroll more evenly across the roster?
More specifically, the study evaluates whether payroll efficiency in different spending strategies correlates with:
Wins
Playoff qualification
Super Bowl appearances and victories
3. Methodology
A robust directional distance Data Envelopment Analysis (DEA) was used to evaluate the payroll efficiency of all 32 NFL teams across 10 seasons (2011–2020).
Models analyzed
Four efficiency models were created:
Overall payroll allocation
Star offensive player spending
Star defensive player spending
Starting quarterback spending
Inputs
Salary cap expenditure data, including:
Top 5 salaries
Salaries 6–10
Salaries 11–30
Outputs
Team performance:
Wins
Points per game (PPG)
Yards per offensive play (YOP)
Points allowed per game (PAG)
Yards per defensive play (YDP)
Yards per passing attempt (YPA) for QB analysis
A Monte-Carlo robust DEA approach was used (1,000 resamples per team) to prevent single outlier teams from skewing the results.
4. Participants
32 NFL Teams
10 full seasons of data (2011–2020)
Total dataset = 320 team-seasons
5. Results
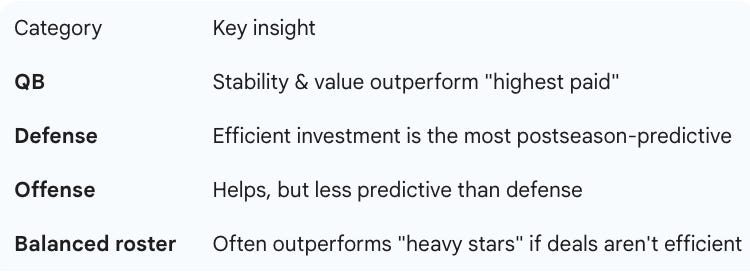
A. Spending Efficiently Works
Across all models:
Teams that ranked higher in payroll efficiency were significantly more likely to reach the playoffs, the Super Bowl, and win championships.
B. Defensively Efficient Spending Was the Most Predictive of Postseason Success
The strongest correlation came from:
Model 3 – spending on star defensive players
Top defensive-efficiency teams included:
New England Patriots
Seattle Seahawks
Pittsburgh Steelers
For example:
Patriots → 9 playoff appearances, 5 Super Bowls, 3 titles (2011–2020).
C. Quarterback Spending Efficiency Highlights Two Paths
The most efficient QB-spending teams generally fell into two groups:
Long-tenure franchise stars on team-friendly deals
e.g., Brady, Wilson, Romo, Prescott
Patriots, Seahawks, Cowboys
Is it all about the stars - Spe…
Elite rookies on low-cost rookie contracts
Teams achieved high efficiency with:
first-round rookies who were outperforming inexpensive contracts
D. Inefficient Spending Correlates with On-Field Failure
Chronic bottom-five teams included:
New York Jets
Jacksonville Jaguars
Cleveland Browns
Tampa Bay Buccaneers
Las Vegas Raiders
These teams collectively:
Made only 4 playoff appearances in 10 years
6. Limitations
The authors note several constraints:
DEA multiplier formulation limits ability to set output targets
Data only includes measurable on-field stats (not leadership, locker room effects, injuries, market size or coaching strategy)
Certain critical variables (e.g., injuries to star players) may distort payroll efficiency scores
7. Implications
For General Managers
The data suggests:
Star defensive spending offers the highest competitive leverage
Teams should seek:
Team-friendly deals with top QBs
Maximizing value during rookie contract windows
Spending big isn’t enough — spending efficiently is what predicts wins.
For Coaches & Performance Directors
Performance impact is maximized when:
For Analysts
Payroll efficiency may serve as a:
leading performance indicator
that predicts team postseason performance better than raw spend or cap allocation alone.
8. Recommendations
NFL teams can improve competitive positioning by:
1. Prioritizing defensive star efficiency
Do not underinvest in elite defensive roles (CB, edge, defensive disruptors)
This category most strongly predicts playoff advancement.
2. Exploiting QB contract windows
Maximize championship runs when elite QBs are on rookie deals
Minimize high cap % bloat for aging or plateauing quarterback performance
3. Avoiding sunk-cost bias
Do not force playing time or strategic prioritization because of salary — many failing teams continued overplaying expensive underperformers.
Is it all about the stars - Spe…
4. Enhancing front-office decision frameworks
Teams should incorporate:
DEA-style efficiency benchmarking
Salary cap resource allocation modeling
Injury and absence adjustments (significant performance impacts)
Conclusion
Across a decade of data:
Payroll efficiency—not total spending—was the strongest predictor of playoff qualification and Super Bowl success.
And:
Investment in star defensive talent produced the highest postseason returns across all models.
Teams that:
Managed the cap efficiently
Avoided overpaying singular stars
Exploited rookie-contract windows
Built strong defensive cores
were statistically more likely to reach the postseason and win championships than teams that simply spent more.
You may also like:
📚 Upside Studies: (1) Soccer Study: Evening Smartphone Exposure Impairs Sleep Quality (2) NBA Study: Optimizing Offensive Gameplan with ML (3) Force Plate Jump Study, and More

⚽ Upside Study (1): Evening Smartphone Exposure Impairs Sleep Quality and Next-Day Performance in Elite Soccer Players: A Randomized Controlled Trial