
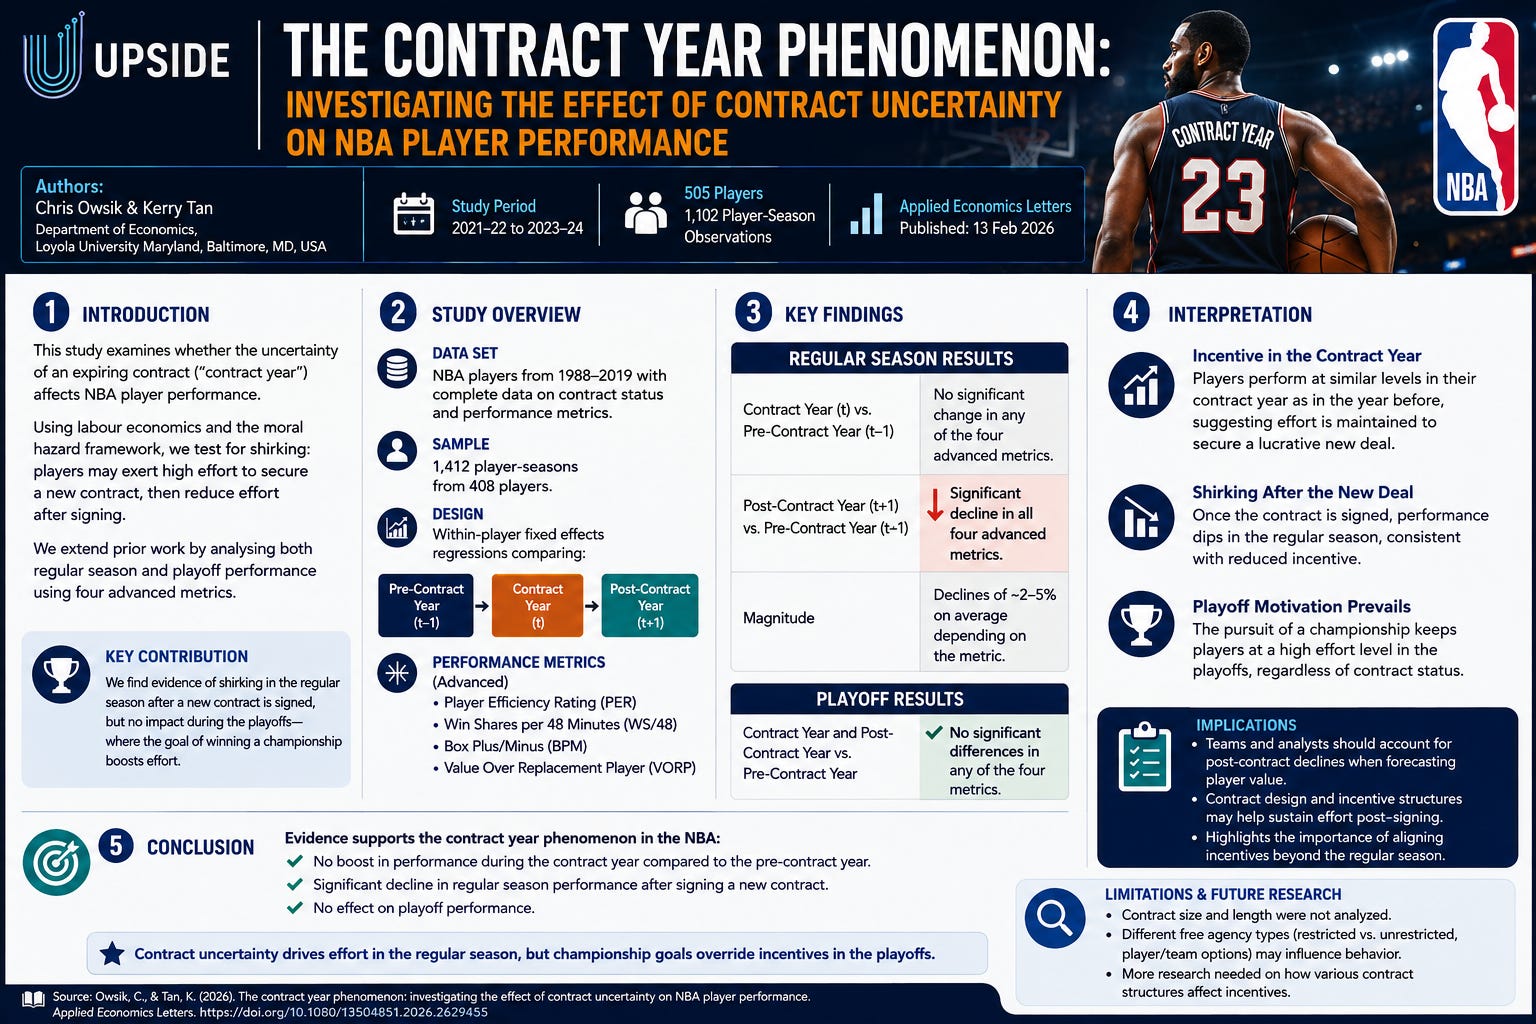
🏀 Upside NBA Study: The Contract Year Phenomenon – Investigating the Effect of Contract Uncertainty on NBA Player Performance
Published in Applied Economics Letters (2026) by Chris Owsik & Kerry Tan, Department of Economics, Loyola University Maryland.
🧩 Introduction
Does the pressure of an expiring NBA contract actually motivate players to perform better?
The “contract year phenomenon” is a long-standing theory in sports economics suggesting that athletes increase their effort when approaching free agency to maximize the value of their next contract, then potentially reduce effort after securing a new deal (often referred to as shirking).
Previous NBA studies have produced mixed findings, many relying on older datasets and traditional performance statistics. This study updates the evidence using modern NBA data and advanced analytics while also examining whether contract status affects playoff performance—a question that had not previously been studied.
Authors:
Chris Owsik & Kerry Tan
Department of Economics, Loyola University Maryland, Baltimore, Maryland, USA.
To read the full study click on the button below:
🧪 Study Overview
Design: Fixed-effects regression analysis using player-season data.
Study Period:
Baseline season: 2021–22
Contract year: 2022–23
Post-contract year: 2023–24
Participants:
505 NBA players
1,102 player-season observations
542 observations with playoff data
Data Sources:
Basketball Reference
NBA Free Agent Tracker
Performance Metrics:
Player Efficiency Rating (PER)
Box Plus-Minus (BPM)
Value Over Replacement Player (VORP)
Win Shares per 48 Minutes (WS/48)
The analysis controlled for player age, team, awards (MVP, All-Star, All-NBA), player fixed effects, and season effects.
📈 Key Findings and Statistical Results
🚨 Contract Year Performance
Contrary to the popular belief that players “play harder” before free agency:
No statistically significant improvement was found in PER
No significant change in BPM
No significant change in VORP
No significant change in WS/48
Compared with the previous season, NBA players generally performed at similar levels during their contract year.
📉 Performance Declines After Signing a New Contract
The strongest finding occurred after players signed their new contracts.
Regular-season performance declined significantly across every advanced metric:
PER: ↓ 0.92 points (~6.4%)
BPM: Significant decline
VORP: Significant decline
WS/48: Significant decline
These results are consistent with evidence of reduced effort (shirking) following a new contract.
🏆 Playoffs Tell a Different Story
Unlike the regular season:
Contract year had no significant effect on playoff performance.
Post-contract year also showed no decline in playoff metrics.
The authors suggest that the pursuit of an NBA championship provides a strong incentive for players to maintain maximum effort regardless of contract status.
🧠 Implications for NBA Teams, Agents, and Front Offices
This study suggests that contract incentives may influence player effort differently across the NBA calendar.
Key implications include:
Contract years do not necessarily produce statistically better performance.
Teams may slightly overestimate the “contract year boost.”
Performance forecasting should account for possible declines during the first season of a new contract.
Championship aspirations appear to offset financial incentive effects during the playoffs.
📌 Recommendations
For NBA Front Offices
Consider potential post-contract performance declines during contract valuation.
Use multi-year performance trends rather than assuming contract-year improvement.
Separate regular-season and playoff evaluations when assessing player value.
For Sports Analytics Companies
Build predictive models that incorporate contract cycle effects.
Include contract status as a contextual variable when forecasting future player performance.
Continue validating incentive effects across different player types and contract structures.
These recommendations are informed by the study’s findings and their practical implications.
⚠️ Limitations
The authors note several areas for future research:
Contract size and contract length were not analyzed.
Different free agency types (restricted vs. unrestricted, player/team options) may influence behavior differently.
Additional work is needed to determine how various contract structures affect player incentives.
✅ Conclusion
Using modern NBA data and advanced performance metrics, this study finds no evidence that players significantly improve their performance during a contract year. However, it finds consistent evidence of declining regular-season performance after signing a new contract, while playoff performance remains unaffected.
These findings support the idea that financial incentives may influence effort during the regular season, but the motivation to compete for an NBA championship appears strong enough to maintain performance regardless of contract status. For NBA organizations, incorporating contract-cycle effects into player evaluation and long-term roster planning could improve decision-making.
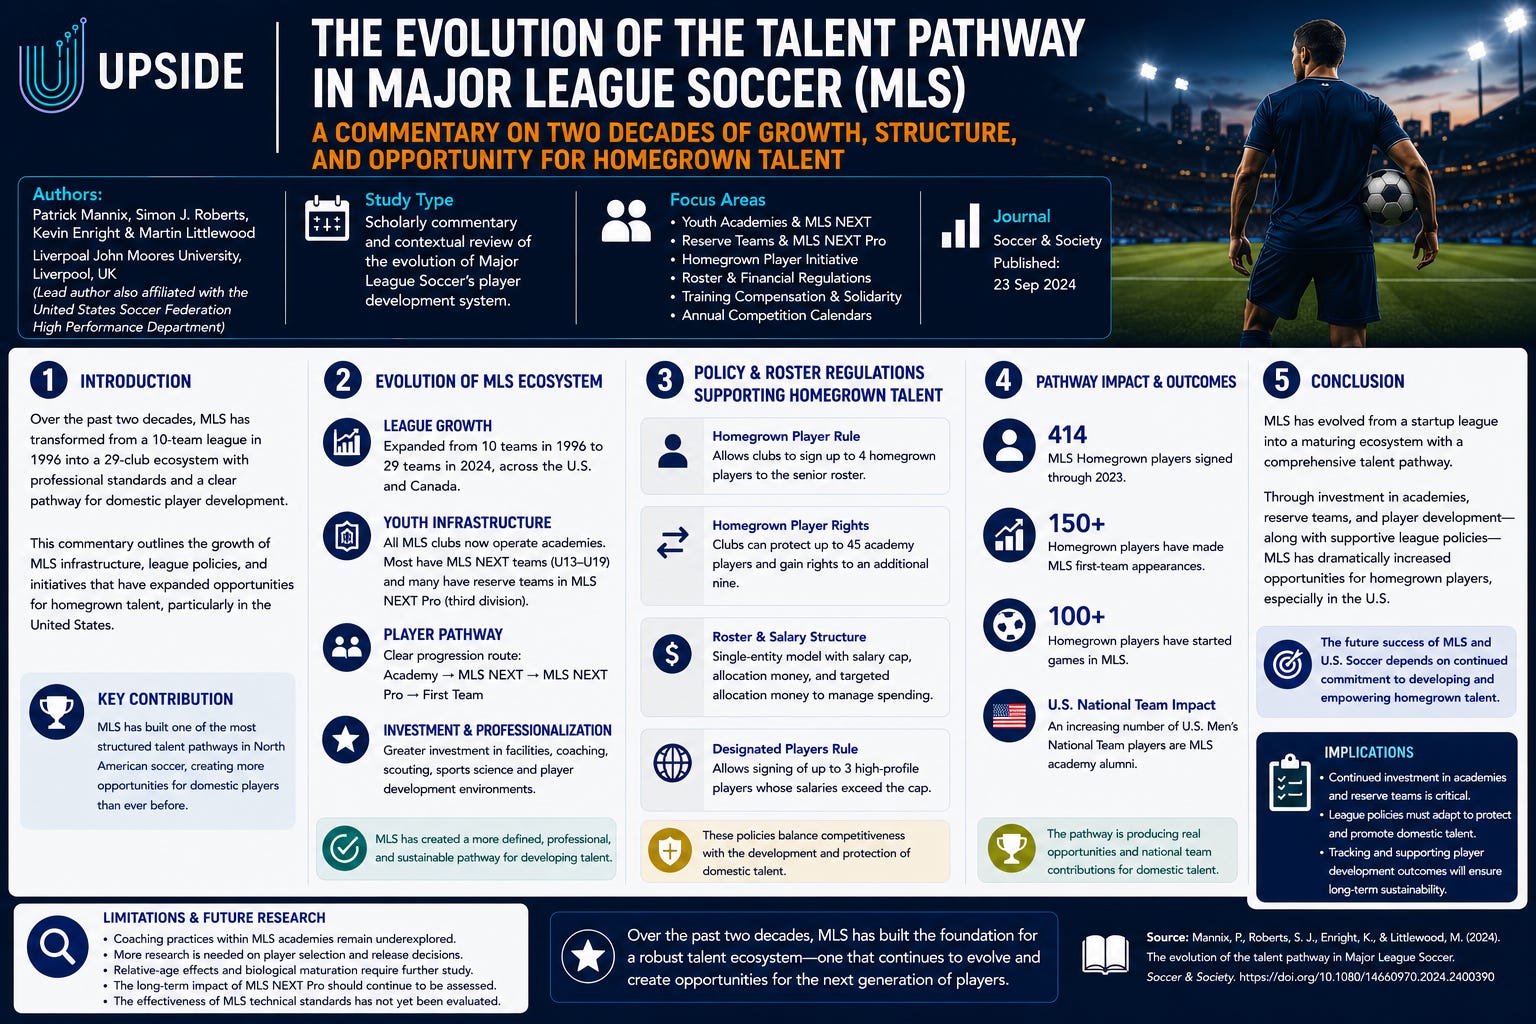
⚽ Upside Study: The Evolution of the Talent Pathway in Major League Soccer (MLS)
Published in Soccer & Society (2024) by Patrick Mannix, Simon J. Roberts, Kevin Enright & Martin Littlewood.
🧩 Introduction
How has Major League Soccer transformed from a startup league into one of the world’s fastest-growing player development systems?
Over the past two decades, MLS has invested heavily in youth academies, reserve teams, coaching infrastructure, and player development initiatives designed to create a clear pathway from academy soccer to the professional game.
Unlike traditional European football systems, MLS operates under a unique single-entity business model with league-controlled roster regulations, Homegrown Player rules, and centralized development initiatives. As the league continues expanding ahead of the 2026 FIFA World Cup, understanding how this pathway has evolved is increasingly important.
Rather than testing a specific hypothesis, this commentary provides a comprehensive overview of the MLS player development ecosystem, highlights its evolution, and identifies opportunities for future research and improvement.
Authors:
Patrick Mannix
Simon J. Roberts
Kevin Enright
Martin Littlewood
Liverpool John Moores University
(Lead author also affiliated with the United States Soccer Federation High Performance Department)
To read the full study click on the button below:
🧪 Study Overview
Study Type
Scholarly commentary and contextual review of Major League Soccer’s player development system.
Focus Areas
Youth Academies & MLS NEXT
Reserve Teams & MLS NEXT Pro
Homegrown Player Initiative
Roster & Financial Regulations
Training Compensation & Solidarity Payments
Annual Competition Calendars
Rather than conducting statistical analysis, the paper synthesizes league policies, historical developments, and organizational changes that have shaped MLS’s professional player pathway.
📈 Key Findings
🌱 MLS Has Built a Clearer Development Pathway
The authors conclude that MLS has significantly strengthened its player development structure over the past two decades through coordinated investments in:
Youth academies
Reserve teams
Professional training environments
MLS NEXT
MLS NEXT Pro
Together, these initiatives provide a more direct pathway from academy soccer to first-team professional football.
🧒 Youth Academies Have Become the Foundation
Since launching academy initiatives in 2007 and the Homegrown Player program in 2008:
Clubs increasingly prioritize academy development over traditional player acquisition.
MLS NEXT now serves as the league’s primary elite youth competition.
MLS clubs collectively invested more than $70 million in academy development in 2019.
🔄 MLS NEXT Pro Strengthens the Professional Transition
One of the league’s most significant developments has been creating MLS NEXT Pro.
The reserve league now serves as the bridge between academy soccer and MLS first teams by providing young players with consistent professional competition before reaching the senior roster.
🏠 Homegrown Rules Encourage Long-Term Development
The Homegrown Player initiative allows clubs to develop and sign academy players directly to MLS contracts.
Recent updates to territorial recruiting rules also provide greater flexibility while allowing clubs to retain exclusive rights to selected academy prospects.
💰 League Policies Reinforce Investment
MLS roster regulations—including salary budgets, allocation money, Designated Player rules, and FIFA training compensation—are designed to balance competitive parity while encouraging clubs to continue investing in youth development.
📊 By the Numbers
⚽ 29 MLS clubs competing across the United States and Canada (2024).
📈 League expansion from 10 clubs (1996) to 29 clubs (2024).
💰 $70+ million invested by MLS clubs in youth academies during 2019.
👦 U13–U19 age groups supported through MLS NEXT, the league’s elite youth competition.
🏟️ A fully integrated player pathway:
Academy → MLS NEXT → MLS NEXT Pro → MLS First Team.
💵 Club salary budgets are scheduled to increase from $4.9 million (2021) to $7.07 million (2027) under the collective bargaining agreement.
🧠 Implications for MLS Clubs and Soccer Organizations
The paper suggests that MLS has created one of the most structured player development systems in North American sports.
Key implications include:
Youth academies have become central to player development.
Reserve teams improve the transition from youth soccer to the professional game.
Homegrown Player policies incentivize clubs to invest in long-term talent development.
Financial and roster regulations help support sustainable growth.
Continued refinement of player identification and development practices remains essential.
📌 Recommendations
For MLS Clubs
Continue investing in academy infrastructure and coaching.
Strengthen collaboration between academy, reserve, and first-team staff.
Develop individualized transition plans for academy players.
Evaluate reserve-team effectiveness in preparing players for MLS competition.
For Researchers
Study coaching practices within MLS academies.
Investigate relative-age effects and biological maturation in player selection.
Evaluate MLS NEXT Pro’s long-term impact on player development.
Examine how league policies influence player progression.
These recommendations are drawn from research areas identified by the authors for future study.
⚠️ Limitations
The authors acknowledge several important gaps requiring additional research:
Coaching practices within MLS academies remain underexplored.
More research is needed on player selection and release decisions.
Relative-age effects and biological maturation require further investigation.
The effectiveness of MLS technical standards has not yet been fully evaluated.
The long-term developmental impact of MLS NEXT Pro should continue to be assessed.
✅ Conclusion
This commentary demonstrates how Major League Soccer has evolved from a relatively small professional league into a comprehensive player development ecosystem.
Through investments in youth academies, reserve teams, MLS NEXT, MLS NEXT Pro, Homegrown Player initiatives, and modern roster policies, MLS has created a clearer pathway for developing domestic talent than at any point in its history.
While important research questions remain regarding player identification, coaching practices, and long-term development outcomes, the authors conclude that MLS has established a strong foundation for future growth and is well positioned to continue expanding opportunities for North American players.
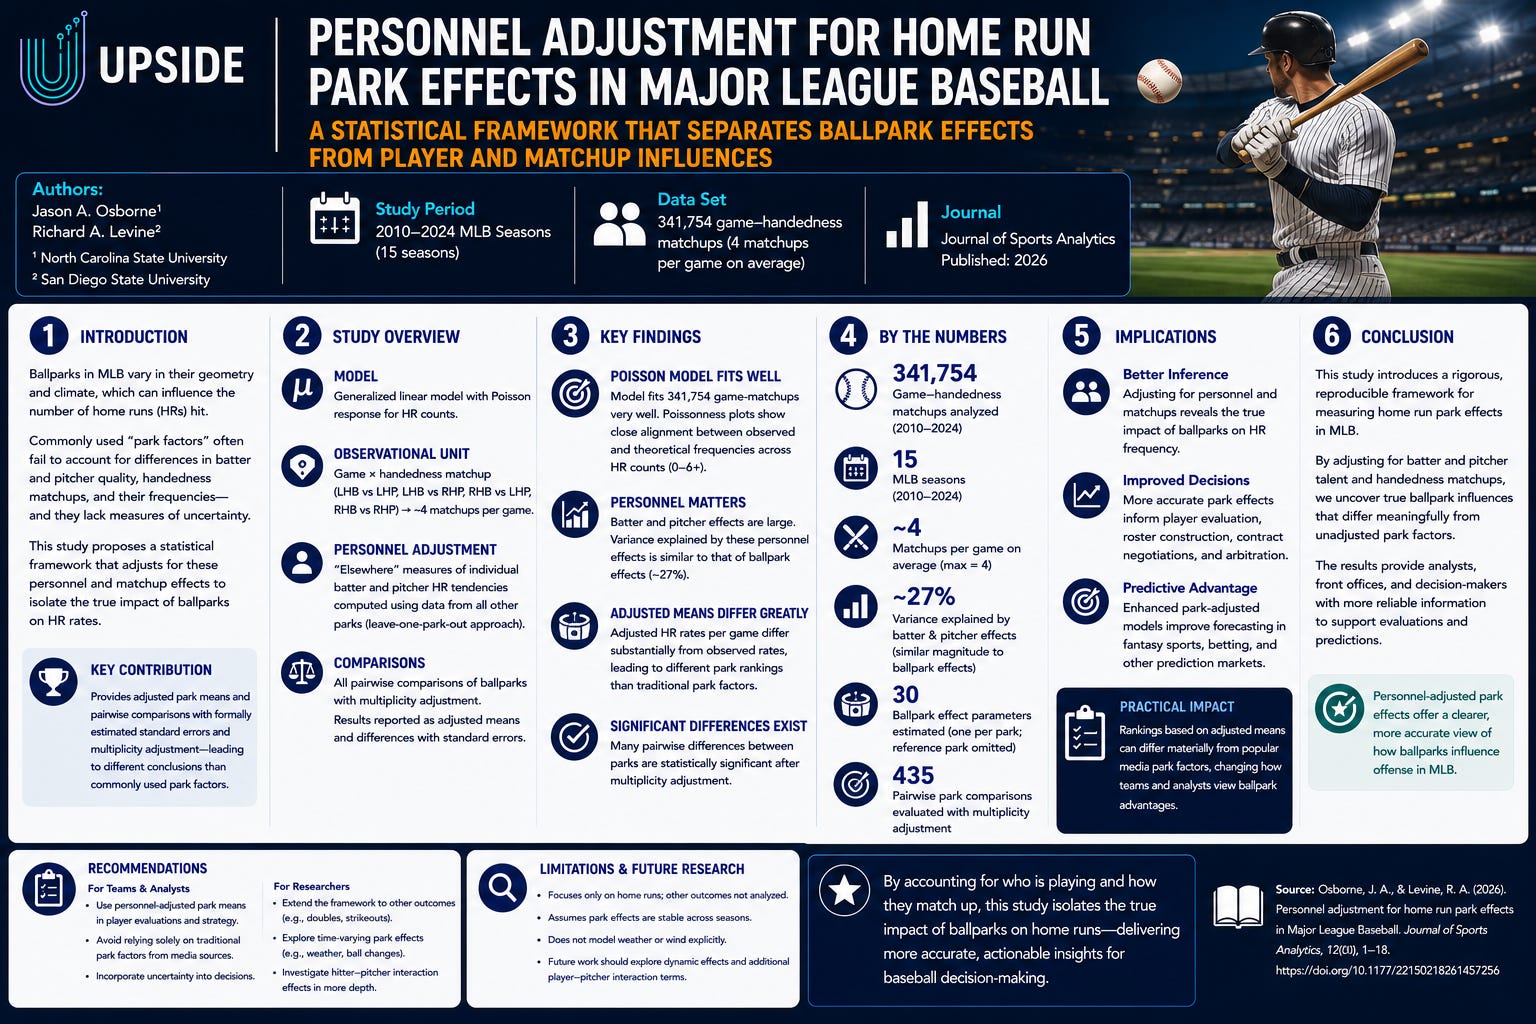
⚾ Upside MLB Study: Personnel Adjustment for Home Run Park Effects in Major League Baseball
Published in the Journal of Sports Analytics (2026)
Authors:
Jason A. Osborne (North Carolina State University)
Richard A. Levine (San Diego State University)
🧩 Introduction
How much does a baseball stadium actually influence home-run production—and how much of that effect is driven by the players competing there?
Traditional MLB park factors compare offensive production at home versus on the road to estimate whether a ballpark favors hitters or pitchers. While widely used by analysts, teams, and fantasy baseball players, these methods often fail to account for differences in player quality, pitcher strength, lineup composition, or batter–pitcher handedness.
This study introduces a statistical framework that isolates the true impact of each Major League ballpark by adjusting for the personnel playing in those games. Rather than assuming every home run reflects the stadium itself, the authors estimate what home-run production would look like under league-average playing conditions.
To read the full study click on the button below:
🧪 Study Overview
Study Type
Statistical modeling study using generalized linear mixed-effects models (Poisson regression).
Study Period
2010–2024 MLB Seasons
Dataset
34,729 MLB games
2.63 million plate appearances
133,220 game-matchup observations
30 Major League ballparks
Each game was separated into four batter–pitcher handedness combinations:
Left-handed batter vs. Left-handed pitcher
Left-handed batter vs. Right-handed pitcher
Right-handed batter vs. Left-handed pitcher
Right-handed batter vs. Right-handed pitcher
The model also incorporated player-specific offensive and pitching tendencies along with season effects.
📈 Key Findings
⚾ Personnel Matters More Than Most Park Factors Assume
One of the study’s biggest findings is that ballpark effects can be heavily influenced by the quality of the players appearing in each stadium.
The researchers found that hitter ability explains substantially more variation in home-run production than pitcher ability, meaning traditional park factors may overestimate or underestimate the true influence of certain ballparks.
🔄 Adjusting for Players Changes Ballpark Rankings
After removing the influence of player talent and matchup frequencies, several stadiums moved dramatically in the rankings.
Some parks that appeared extremely hitter-friendly under traditional methods became much more average after adjustment, while others ranked significantly higher once player effects were removed.
This demonstrates that observed home-run totals alone do not always reflect the true characteristics of a stadium.
🏟️ Ballpark Effects Depend on Handedness
Rather than producing one universal “park factor,” the study found that stadium effects vary depending on the batter–pitcher matchup.
A park may strongly favor left-handed hitters while having a much smaller effect on right-handed hitters, emphasizing the importance of evaluating park effects separately by handedness.
🏟️ Ballpark-Specific Findings
🔴 Great American Ball Park: Most Home-Run Friendly Overall
After adjusting for batter quality, pitcher quality, and handedness frequencies, Great American Ball Park in Cincinnatiranked as MLB’s most home-run-friendly stadium.
Its estimated personnel-adjusted rate was:
2.55 home runs per game
It also ranked first for:
Left-handed batters facing right-handed pitchers: 0.93 HR/game
Right-handed batters facing right-handed pitchers: 0.96 HR/game
The study found that Cincinnati’s adjusted overall mean was significantly higher than the means for 17 less home-run-friendly parks.
🏔️ Coors Field: Second Overall
Coors Field in Colorado ranked second after personnel adjustment, with an estimated:
2.44 home runs per game
Coors Field ranked:
First for left-handed batter vs. left-handed pitcher matchups
First for right-handed batter vs. left-handed pitcher matchups
Second for right-handed batter vs. right-handed pitcher matchups
Sixth for left-handed batter vs. right-handed pitcher matchups
This confirms that Coors remains strongly home-run friendly even after controlling for the hitters and pitchers appearing there.
🗽 Yankee Stadium: Friendly, but Personnel Inflates the Raw Total
Yankee Stadium recorded the highest observed home-run rate in the study:
2.74 home runs per game
However, after adjustment, its estimated rate declined to:
2.34 home runs per game
That moved Yankee Stadium from first based on observed production to third overall after adjustment, behind Cincinnati and Colorado. The study attributes part of the difference to the above-average home-run tendencies of players appearing there.
Yankee Stadium was especially favorable to left-handed hitters:
Fourth for left-handed batters vs. left-handed pitchers
Second for left-handed batters vs. right-handed pitchers
Its personnel-adjusted estimate for left-handed batters facing right-handed pitchers was 0.864 home runs per game, compared with an observed rate of 1.017.
🌉 Oracle Park: Most Home-Run Suppressive Overall
Oracle Park in San Francisco ranked as the least home-run-friendly stadium after adjustment, with an estimated:
1.52 home runs per game
It ranked last overall and also ranked last for left-handed batters facing right-handed pitchers.
For that matchup, Oracle Park’s adjusted mean was significantly lower than the means for all but four other parks, reinforcing its reputation as one of MLB’s most difficult environments for home-run hitting.
🏴☠️ PNC Park: Especially Difficult in Certain Matchups
PNC Park in Pittsburgh ranked near the bottom overall, with an adjusted estimate of:
1.64 home runs per game
It was particularly difficult for:
Left-handed batters facing left-handed pitchers
Right-handed batters facing left-handed pitchers
For left-on-left matchups, its adjusted rate was approximately 0.10 home runs per game, or about one home run every ten games involving that matchup.
🧢 Progressive Field: Raw Totals Overstated the Park Effect
For left-handed batters facing right-handed pitchers, Progressive Field in Cleveland appeared to be MLB’s most home-run-friendly stadium based on observed results:
1.04 home runs per game — ranked first
After adjusting for the quality and frequency of the hitters and pitchers involved, the estimate dropped to:
0.67 home runs per game — ranked 14th
This 13-position decline was one of the clearest examples of personnel creating a misleading impression of a ballpark’s home-run friendliness.
⚫ Rate Field: More Hitter-Friendly Than the Raw Data Suggested
For left-handed batters facing right-handed pitchers, Chicago’s Rate Field initially ranked only 19th based on its observed rate of:
0.72 home runs per game
After adjustment, its estimate increased to:
0.78 home runs per game — ranked seventh
The study explains that the park hosted comparatively low-home-run personnel. Once those player effects were removed, the ballpark appeared considerably more favorable to home runs.
🍁 Rogers Centre: Player Quality Inflated Its Apparent Effect
For right-handed batters facing right-handed pitchers, Rogers Centre in Toronto had MLB’s highest observed rate:
1.17 home runs per game — ranked first
After personnel adjustment, it declined to:
0.78 home runs per game — ranked 11th
The authors found that Rogers Centre had hosted unusually strong home-run personnel and a high frequency of right-handed matchups, making the park appear more favorable than its adjusted estimate suggested.
Overall, Toronto fell from fourth in observed home runs to 10th after adjustment.
🔵 Dodger Stadium: More Home-Run Friendly After Adjustment
For right-handed batters facing right-handed pitchers, Dodger Stadium rose from:
20th based on observed home runs
to:
Fourth after personnel adjustment
The study found that right-handed pitchers appearing at Dodger Stadium had the lowest “elsewhere” home-run-allowance measure in MLB. In other words, strong home-run-preventing pitchers had made the stadium appear less hitter-friendly than it actually was.
🔔 Citizens Bank Park: Stronger After Personnel Adjustment
Citizens Bank Park in Philadelphia also became more home-run friendly after adjustment.
It ranked:
Sixth for right-handed batters facing left-handed pitchers
Third for right-handed batters facing right-handed pitchers
Fourth overall, at 2.33 adjusted home runs per game
For right-handed batters facing left-handed pitchers, it rose from 20th based on observed rates to sixth after adjustment.
📊 Overall Adjusted Ballpark Rankings
Most Home-Run Friendly
Great American Ball Park, Cincinnati — 2.55 HR/game
Coors Field, Colorado — 2.44 HR/game
Yankee Stadium, New York — 2.34 HR/game
Citizens Bank Park, Philadelphia — 2.33 HR/game
American Family Field, Milwaukee — 2.31 HR/game
Least Home-Run Friendly
Oracle Park, San Francisco — 1.52 HR/game
loanDepot Park, Miami — 1.57 HR/game
PNC Park, Pittsburgh — 1.64 HR/game
Oakland Coliseum — 1.64 HR/game
Busch Stadium, St. Louis — 1.68 HR/game
These rankings represent expected home runs under league-average personnel and matchup conditions—not simply the raw number of home runs observed in each stadium.
📊 The Statistical Model Performed Well
The proposed model produced nearly identical predictive accuracy on new seasons compared with the seasons used to build it.
This suggests the framework provides a reliable and reproducible method for estimating home-run park effects.
📊 By the Numbers
⚾ 34,729 MLB games analyzed.
🏟️ 30 Major League ballparks evaluated.
📈 2.63 million plate appearances included.
🔄 133,220 game-and-matchup observations.
👥 4 batter–pitcher handedness combinations modeled separately.
🧮 435 pairwise ballpark comparisons performed.
📅 15 seasons of MLB data (2010–2024).
🧠 Implications for MLB Organizations
The findings suggest that organizations should be cautious when interpreting traditional park factors.
More accurate personnel-adjusted estimates can improve:
Player evaluation
Contract negotiations
Free-agent analysis
Trade decisions
Player projections
Sports analytics
Fantasy baseball forecasting
Because player talent and matchup distributions influence observed home-run totals, separating these effects provides a clearer understanding of a stadium’s true offensive environment.
📌 Recommendations
For MLB Teams
Use personnel-adjusted park factors when evaluating hitters and pitchers.
Evaluate stadium effects separately by batter–pitcher handedness.
Incorporate uncertainty into player valuation and projection models.
Avoid relying solely on traditional home-versus-road park factors.
For Baseball Analysts
Continue refining park-effect models using player-specific information.
Expand statistical models to include environmental factors such as weather.
Study additional offensive outcomes beyond home runs.
Develop player projections that account for changing ballpark environments.
⚠️ Limitations
The authors note several limitations that offer opportunities for future research:
Weather conditions (wind, temperature, humidity) were not explicitly modeled.
Changes in ballpark dimensions over time were not included.
Player aging and year-to-year skill changes were not directly incorporated.
Statcast variables such as exit velocity and launch angle were not analyzed.
The model focuses specifically on home-run production rather than overall offensive performance.
✅ Conclusion
This study presents a more rigorous approach to measuring home-run park effects by separating the influence of stadium characteristics from the players competing within them.
By adjusting for hitter ability, pitcher quality, and batter–pitcher handedness, the authors demonstrate that several commonly accepted park rankings change substantially after accounting for personnel differences.
The proposed framework provides MLB organizations, analysts, and researchers with a more accurate method for evaluating offensive environments and highlights the importance of considering player context when interpreting ballpark effects.
Ultimately, the study reinforces a key principle in baseball analytics: to understand the true impact of a ballpark, you must first account for the players who play inside it.
You may like:
📚 Upside Studies: (1) The Impact of Daylight Exposure on Injured Athletes: Implications for Rehabilitation. (2) Sleep Study. (3) Pattern of Injuries in Basketball Players

Upside study: The Impact of Daylight Exposure on Injured Athletes: Implications for Rehabilitation
📚 Upside Studies: (1) NBA Study: Technical Fouls (2)MLB Study: In-Game Markerless & Lab Marker-Based Pitching Biomechanics (3) NHL Study: Determinants of Skating Speed In Ice Hockey Athletes

Upside Study #1: Strategic Impact of Technical Fouls in Basketball: A Two-Decade Analysis of Momentum Shifts in the NBA (2000–2021)
📚 Upside Studies: (1) Soccer Study: Evening Smartphone Exposure Impairs Sleep Quality (2) NBA Study: Optimizing Offensive Gameplan with ML (3) Force Plate Jump Study, and More

⚽ Upside Study (1): Evening Smartphone Exposure Impairs Sleep Quality and Next-Day Performance in Elite Soccer Players: A Randomized Controlled Trial