
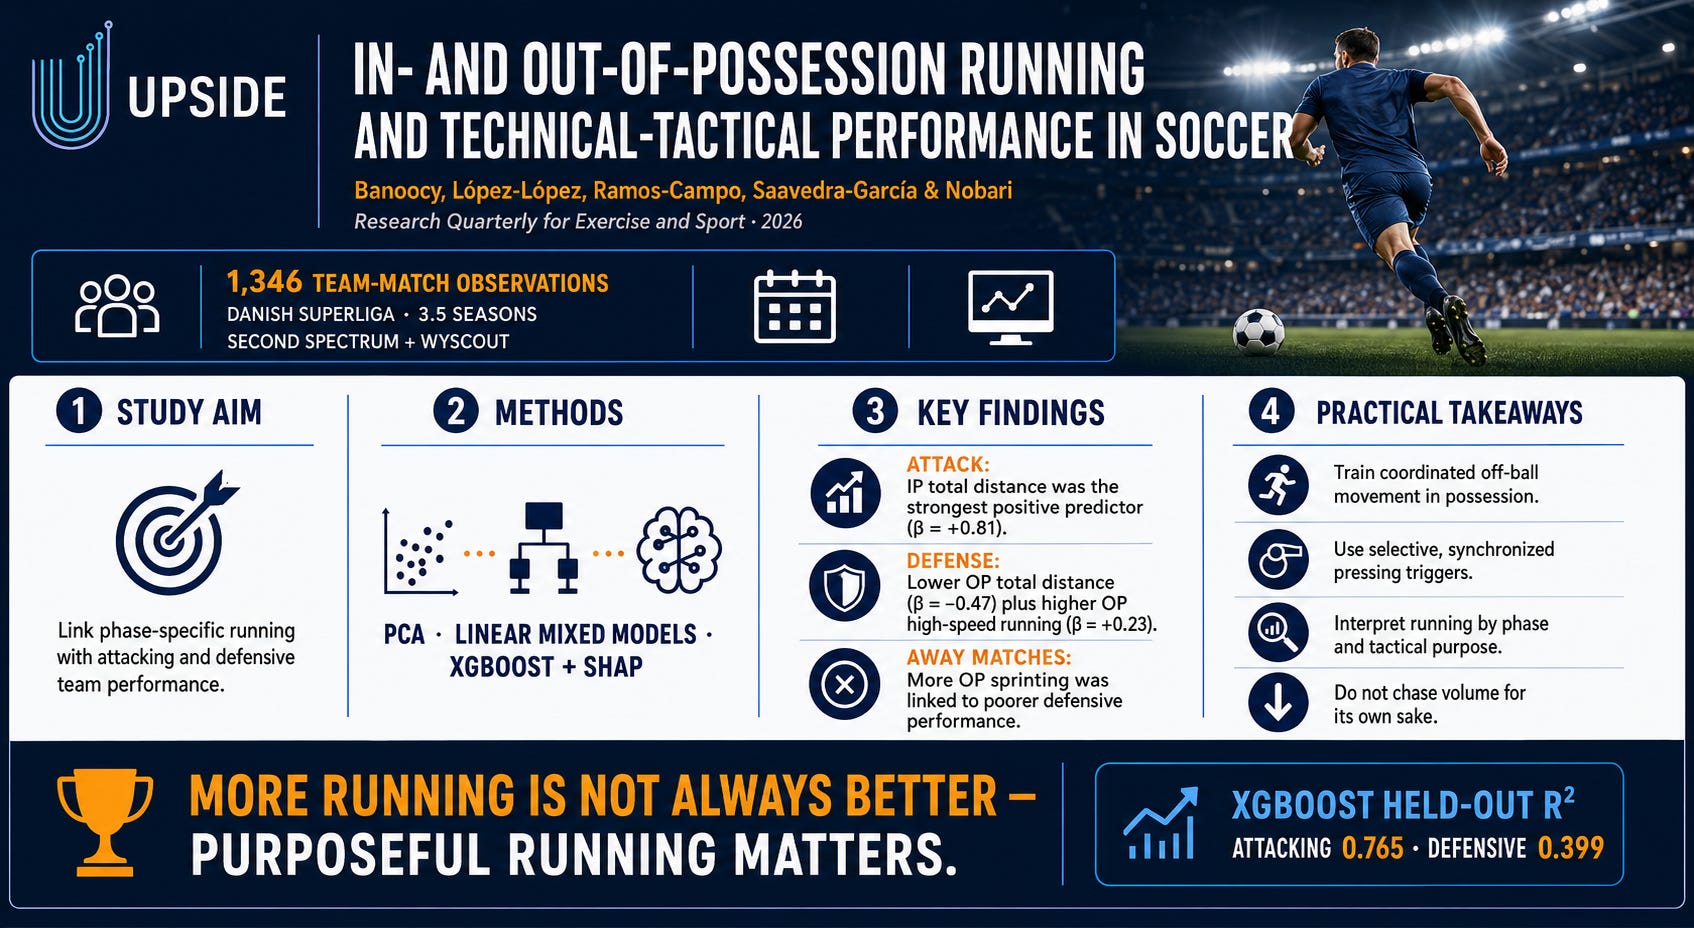
⚽ Upside Soccer Study: In- and Out-of-Possession Running and Technical-Tactical Performance
Published in Research Quarterly for Exercise and Sport (2026) by Norbert Banoocy, Daniel López-López, Domingo Jesús Ramos-Campo, Miguel Ángel Saavedra-García & Hadi Nobari.
🧩 Introduction
Does covering more distance help a professional soccer team perform better?
This study suggests the answer depends on when, how and why the running occurs.
Whole-match running totals can hide important tactical differences. Movement while a team has possession may support passing options, spacing and progression, while excessive out-of-possession running may indicate that a team is chasing the ball rather than defending efficiently.
The researchers examined how running during in-possession and out-of-possession phases relates to attacking and defensive performance.
Authors:
Norbert Banoocy
Daniel López-López
Domingo Jesús Ramos-Campo
Miguel Ángel Saavedra-García
Hadi Nobari
Institutions:
Universidade da Coruña
Universidad Politécnica de Madrid
Click on the Botton below to download the full study:
🧪 Study Overview
Design: Retrospective observational study using team-level match data.
Competition: Danish Superliga, Denmark’s top-tier professional soccer league.
Study period: 3.5 consecutive seasons.
Sample:
1,346 team-match observations
One observation per team per match
All participating teams during the study period
Data sources:
Second Spectrum optical tracking data
Wyscout technical and tactical event data
Running metrics:
Total distance
High-speed running distance above 19.8 km/h
Sprint distance above 25.2 km/h
Number of high-intensity runs
Each metric was analyzed separately for:
In possession (IP)
Out of possession (OP)
Technical-tactical measures included:
Passing volume and accuracy
Progressive and final-third passing
Possession percentage
Match tempo
Pressing intensity
Ball recoveries
Ball losses
The researchers used principal component analysis to create composite Attacking and Defensive Performance Indices. Linear mixed-effects models tested associations, while XGBoost and SHAP analyses examined predictive importance and potential nonlinear relationships.
📊 Typical Team-Match Physical Output
Across the 1,346 observations, teams averaged:
109.8 km total distance
40.6 km in possession
43.5 km out of possession
6.3 km of high-speed running
1.9 km of sprinting
Approximately 722 high-intensity runs
Distances not classified as in or out of possession occurred during neutral or ball-out-of-play periods.
📈 Key Findings
⚽ Attacking Performance: Coordinated Movement Matters
In-possession total distance was the strongest positive predictor of the Attacking Performance Index:
IP total distance: β = +0.81
Model explained approximately 80% of the variance
Teams that produced more coordinated movement while controlling the ball also tended to demonstrate stronger possession, passing and progression.
This may reflect players continually moving to:
Create passing options
Maintain spacing
Support the ball carrier
Progress the ball into advanced areas
Penetrate defensive lines
🚨 More High-Speed Running Was Not Automatically Better
After controlling for total in-possession movement and other variables:
IP high-speed distance: β = -0.15
IP sprint distance: β = -0.08
These results do not mean that sprinting is harmful. Instead, they suggest that simply adding high-speed running without supporting possession structure may not improve attacking performance.
Greater sprint volumes may sometimes reflect direct, transitional or less-controlled matches rather than sustained attacking organization.
🛡️ Efficient Defending Requires Purposeful Intensity
Out-of-possession total distance was the strongest negative predictor of defensive performance:
OP total distance: β = -0.47
By contrast, out-of-possession high-speed running was positively associated with the Defensive Performance Index:
OP high-speed distance: β = +0.23
Stronger defending was therefore associated with:
Less prolonged out-of-possession running
More purposeful high-speed defensive actions
Organized pressing
Recoveries in advanced areas
Greater defensive efficiency
The results suggest that teams may benefit more from brief, coordinated defensive efforts than from continually chasing the opposition.
🏟️ Away Matches Require Additional Context
Higher out-of-possession sprint distance was associated with poorer defensive performance primarily during away matches.
This may indicate that away teams sometimes perform more reactive, longer-distance sprints after losing their defensive structure.
The relationship was less negative during home matches, where similar sprinting may have been more closely connected to organized pressing or transition actions.
📍 Match Context Had a Limited Effect
Match location had a small positive association with both performance indices:
Attacking Index at home: β = +0.08
Defensive Index at home: β = +0.24
Match result produced statistically significant but practically small effects. Most running-performance relationships did not change meaningfully based on whether teams won, drew or lost.
🤖 Machine-Learning Results
XGBoost models demonstrated:
Strong attacking prediction: held-out R² = 0.765
Moderate defensive prediction: held-out R² = 0.399
SHAP analysis confirmed that:
In-possession total distance dominated attacking predictions.
Out-of-possession total distance dominated defensive predictions.
In-possession variables contributed most to the attacking model.
Out-of-possession variables contributed most to the defensive model.
🧠 Implications for Soccer Teams and Practitioners
The study reinforces that running data should not be interpreted in isolation.
Two teams may cover similar distances but achieve very different outcomes depending on:
Whether the running occurs in or out of possession
The tactical purpose of the movement
Team spacing and coordination
Pressing organization
Match location
Whether players are acting proactively or reacting to lost structure
Whole-match totals may therefore be less informative than phase-specific metrics connected to tactical actions.
📌 Recommendations
For Attacking Preparation
Develop sustained, coordinated movement in possession.
Train overlapping and underlapping support runs.
Include third-player movements and positional rotations.
Reinforce scanning and short support movements.
Time runs behind the defense without disrupting possession structure.
For Defensive Preparation
Use selective, synchronized pressing triggers.
Train repeat high-speed actions within an organized defensive structure.
Reduce prolonged, unproductive chasing.
Prioritize compactness, particularly in away matches.
Connect sprint metrics with pressing and recovery outcomes.
For Performance and Analytics Departments
Separate running data by possession phase.
Link physical outputs to tactical purpose.
Avoid treating greater volume as automatically positive.
Combine tracking and event data when evaluating performance.
Consider venue and tactical context when interpreting sprint totals.
⚠️ Limitations
The authors identified several limitations:
The study was observational, so causality cannot be established.
Data were analyzed at the team-match level rather than by player or position.
Opponent strength, fixture congestion and match importance were not included.
Final match result did not account for time spent winning, drawing or losing.
PPDA does not capture every form of pressing or defensive pressure.
The researchers did not independently audit the Wyscout variables.
Findings came from one European league and may not generalize to other competitions.
Future studies should examine player positions, score states, opponent quality, schedule congestion and differences among leagues.
✅ Conclusion
This study demonstrates that more running is not necessarily better running.
Attacking performance was most strongly associated with sustained, coordinated movement while in possession. Stronger defensive performance combined lower overall out-of-possession distance with more purposeful high-speed activity.
The findings suggest that teams should evaluate physical output through the lens of possession, tactical structure and intent. High-intensity running is most valuable when it supports organized attacking movement or coordinated defensive pressure—not when it simply adds volume.
The central takeaway: purposeful running matters more than running for its own sake.
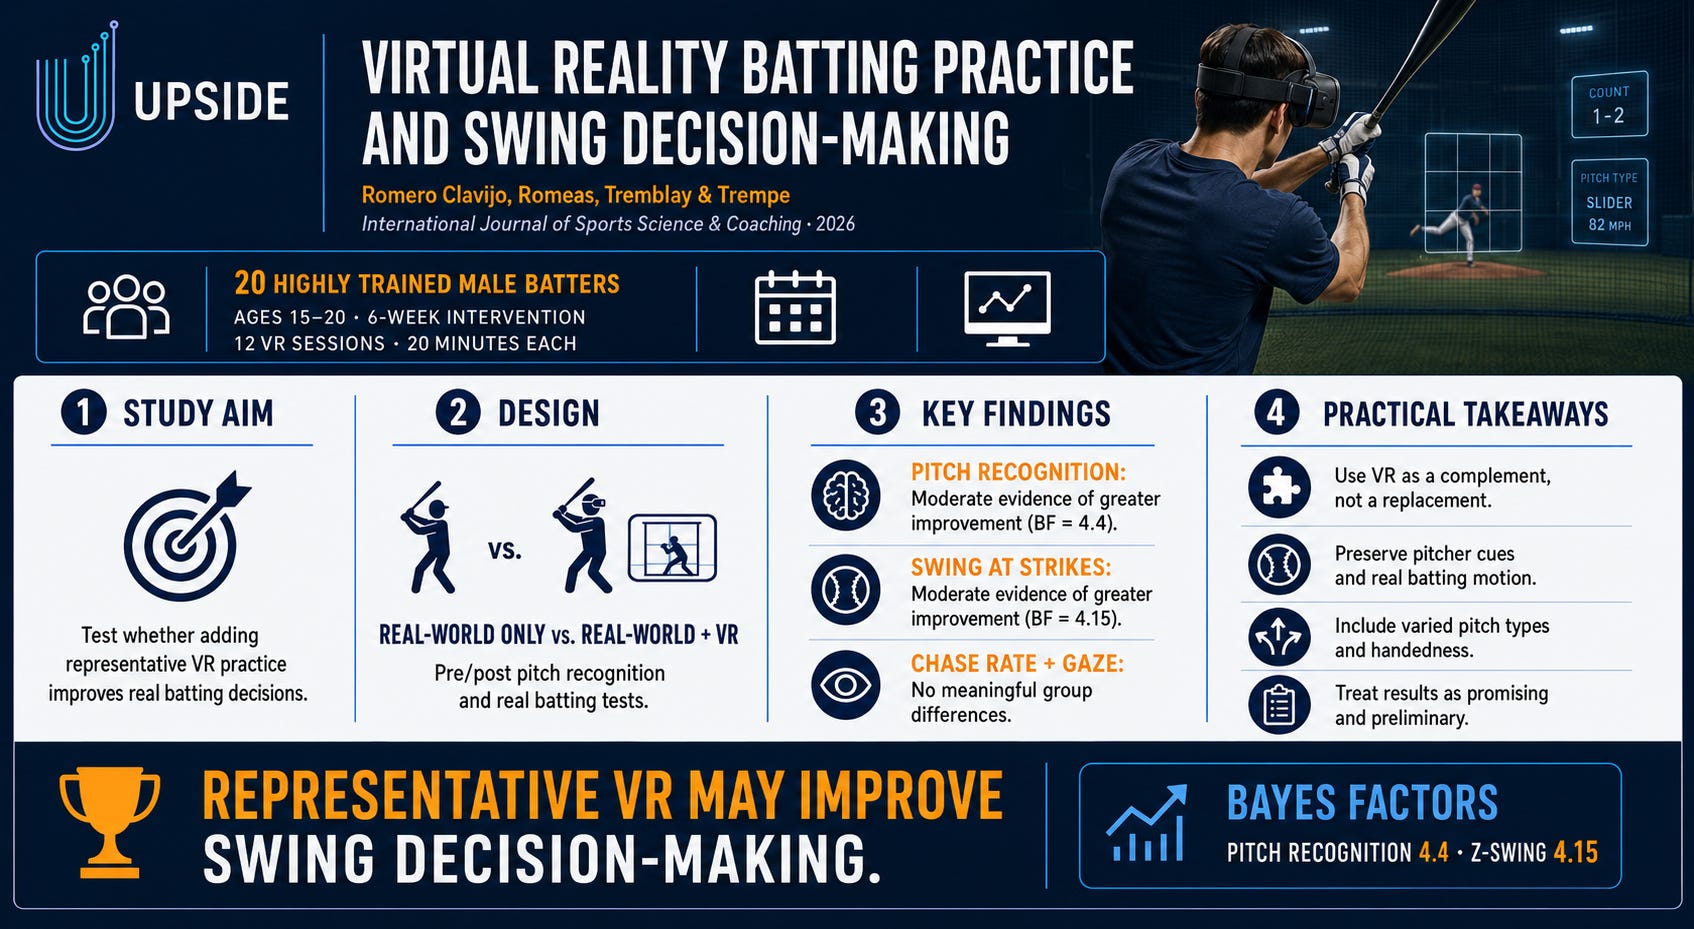
⚾ Upside Baseball Study: Effects of Virtual Reality Batting Practice on Swing Decision-Making
Published in International Journal of Sports Science & Coaching (2026) by Fabian Alberto Romero Clavijo, Thomas Romeas, Mathieu Tremblay & Maxime Trempe.
🧩 Introduction
Can virtual reality batting practice help highly trained baseball players make better swing decisions in real competition?
Batters must rapidly identify visual information from a pitcher’s delivery—including arm movement, grip, release point and ball trajectory—to decide whether to swing.
Traditional training methods such as tees, front tosses and pitching machines provide valuable repetitions, but they do not always reproduce the visual information or decision-making demands of facing a real pitcher. Pitchers also cannot safely deliver unlimited maximum-effort pitches during practice.
This study examined whether replacing part of regular batting practice with representative VR training could improve pitch recognition and real-world plate discipline.
Authors:
Fabian Alberto Romero Clavijo
Thomas Romeas
Mathieu Tremblay
Maxime Trempe
Institutions:
Bishop’s University
Institut national du sport du Québec
Université de Montréal
York University
Université du Québec à Trois-Rivières
Click on the Botton below to download the full study:
🧪 Study Overview
Design: Six-week randomized training intervention with pre- and post-testing.
Participants:
20 highly trained male baseball players
Ages 15–20
Average age: 17.2 years
Average baseball experience: 10.9 years
Recruited from a provincial development program
Training groups:
Real-world practice only: 10 players
Real-world practice plus representative VR: 10 players
Two participants from the VR group who attended fewer than 75% of the sessions were removed from the analysis.
Both groups continued their regular weekday training, which included:
Fielding
Strength and conditioning
Tee work
Front toss
Pitching-machine practice
For the VR group, a portion of regular practice was replaced—not supplemented—with VR batting practice.
🥽 VR Training Protocol
The VR group completed:
12 VR sessions
Two sessions per week
Approximately 20 minutes per session
40 pitches per session
Six weeks of training
Players faced virtual right- and left-handed pitchers matched to their competitive level.
The sessions included randomized:
Fastballs
Breaking balls
Off-speed pitches
Pitching speeds
Pitcher handedness
Pitching kinematics
Players performed actual batting movements and received:
Bat-ball contact sounds
Bat vibration
Visual feedback on hit distance
Visual feedback on hit direction
This design preserved perception-action coupling: players perceived representative pitching information and responded with a realistic batting action.
📊 Performance Assessments
Virtual Pitch-Recognition Test
Players observed 20 randomized pitches and identified:
Pitch type
Pitch location
Where the ball crossed home plate
These measures were combined into a pitch-recognition decision score.
Real Batting Test
Players faced an average of approximately 20 pitches delivered by real pitchers.
Plate discipline was assessed using:
Z-swing percentage: Percentage of pitches inside the strike zone at which the batter swung
O-swing percentage: Percentage of pitches outside the strike zone at which the batter swung
Higher Z-swing values reflected a greater willingness to swing at strikes. Lower O-swing values reflected a greater ability to avoid chasing balls.
Gaze Behavior
Eye tracking measured:
Number of fixations
Fixation duration
Visual search rate
Number and duration of saccades
Predictive-saccade timing
Because of availability and scheduling constraints:
14 players completed both real batting tests
12 players provided complete gaze data
📈 Key Findings
🧠 Pitch Recognition Improved
The real-world plus VR group demonstrated greater improvement on the virtual pitch-recognition test than the real-world-only group.
Bayes factor: 4.4
Interpretation: Moderate evidence favoring a VR-related improvement
The authors suggest that VR gave players additional exposure to representative pitcher movements, pitch trajectories and decision-making situations.
✅ Players Became More Likely to Swing at Strikes
The VR group also demonstrated greater improvement in Z-swing percentage during the real batting test.
Bayes factor: 4.15
Interpretation: Moderate evidence favoring a VR-related improvement
This suggests that representative VR practice transferred beyond the virtual test and may have helped players identify hittable pitches during real batting.
🚫 No Meaningful Change in Chase Rate
The study did not find meaningful evidence that VR reduced swings at pitches outside the strike zone.
O-swing Bayes factor: 0.58
Interpretation: Anecdotal evidence favoring no group difference
The players became more likely to swing at strikes while maintaining similar control over pitches outside the zone. However, the study does not establish that VR improved every aspect of plate discipline.
👁️ Gaze Behavior Did Not Meaningfully Change
The researchers found no meaningful between-group differences across the measured gaze variables.
This suggests that the improvements in swing decision-making could not be explained by broad changes in:
Fixation frequency
Fixation duration
Search rate
Saccade frequency or duration
Predictive-saccade timing
The authors proposed that highly trained players may already possess expert-like gaze patterns. Improvements may instead have resulted from better extraction or interpretation of pitching cues not captured by the selected eye-tracking measures.
🔄 Why Might the Training Have Transferred?
The authors identified two important characteristics of the VR intervention.
Representative Visual Information
The virtual environment reproduced:
Pitcher throwing movements
Ball trajectories
Pitch speed and type
Left- and right-handed deliveries
Realistic temporal demands
This allowed batters to associate pitcher kinematics with subsequent ball flight.
Perception-Action Coupling
Players responded by performing actual swings rather than pressing a button or verbally identifying a pitch.
The system then delivered immediate visual, auditory and haptic feedback. This may have helped players connect perception, decision-making and movement execution under realistic time constraints.
🧠 Implications for Baseball Teams and Practitioners
The findings suggest that representative VR may be a useful complement to conventional batting practice.
VR can provide additional decision-making repetitions without requiring pitchers to throw a large number of maximum-effort pitches. It may also expose batters to greater variability in pitch type, speed, handedness and throwing mechanics.
However, VR should not automatically replace:
Live pitching
Real batting practice
Strength and conditioning
Technical coaching
Other representative training activities
Its value appears to depend on how closely the virtual task reproduces the information, decisions and actions of real batting.
📌 Recommendations
For Baseball Coaches
Use VR as a complement to real batting practice.
Prioritize systems that reproduce pitcher kinematics.
Require realistic batting movements instead of button-press responses.
Include decisions to swing and inhibit swings.
Vary pitch type, speed and pitcher handedness.
For Performance and Skill-Acquisition Staff
Preserve perception-action coupling.
Connect VR drills to specific plate-discipline objectives.
Monitor transfer to real batting rather than relying only on VR scores.
Introduce VR in structured, manageable training blocks.
Avoid adding VR as unplanned extra workload.
For Sports-Technology Companies
Improve visual and temporal fidelity.
Provide realistic auditory, visual and haptic feedback.
Support individualized pitcher and pitch selection.
Develop better measures of cue use and decision quality.
Validate improvements in real-world batting environments.
These recommendations are informed by the study’s findings and their practical implications.
⚠️ Limitations
The authors identified several important limitations:
The initial sample included only 20 players.
Two VR participants were excluded because of low attendance.
Only 14 players completed both real batting assessments.
Only 12 players provided complete gaze data.
All participants were highly trained male players between 15 and 20 years old.
The intervention lasted only six weeks.
There was no VR-only group.
There was no VR-placebo group.
The study did not isolate which VR components produced the improvements.
Broader changes in gaze behavior may require a longer intervention.
Results may not generalize to younger, less experienced, female or professional players.
The authors recommend larger studies beginning earlier in the offseason, with more diverse participants and additional comparison groups.
✅ Conclusion
This exploratory study found moderate evidence that replacing part of conventional batting practice with representative VR training improved:
Virtual pitch-recognition performance
The likelihood of swinging at strikes during real batting
The intervention did not meaningfully reduce swings at pitches outside the strike zone or change the gaze behaviors measured in the study.
The findings suggest that VR may be a promising complementary training tool when it preserves both realistic pitcher information and real batting actions.
The central takeaway: VR is most likely to transfer when athletes do more than see the game—they must perceive, decide and act as they would in the real performance environment.
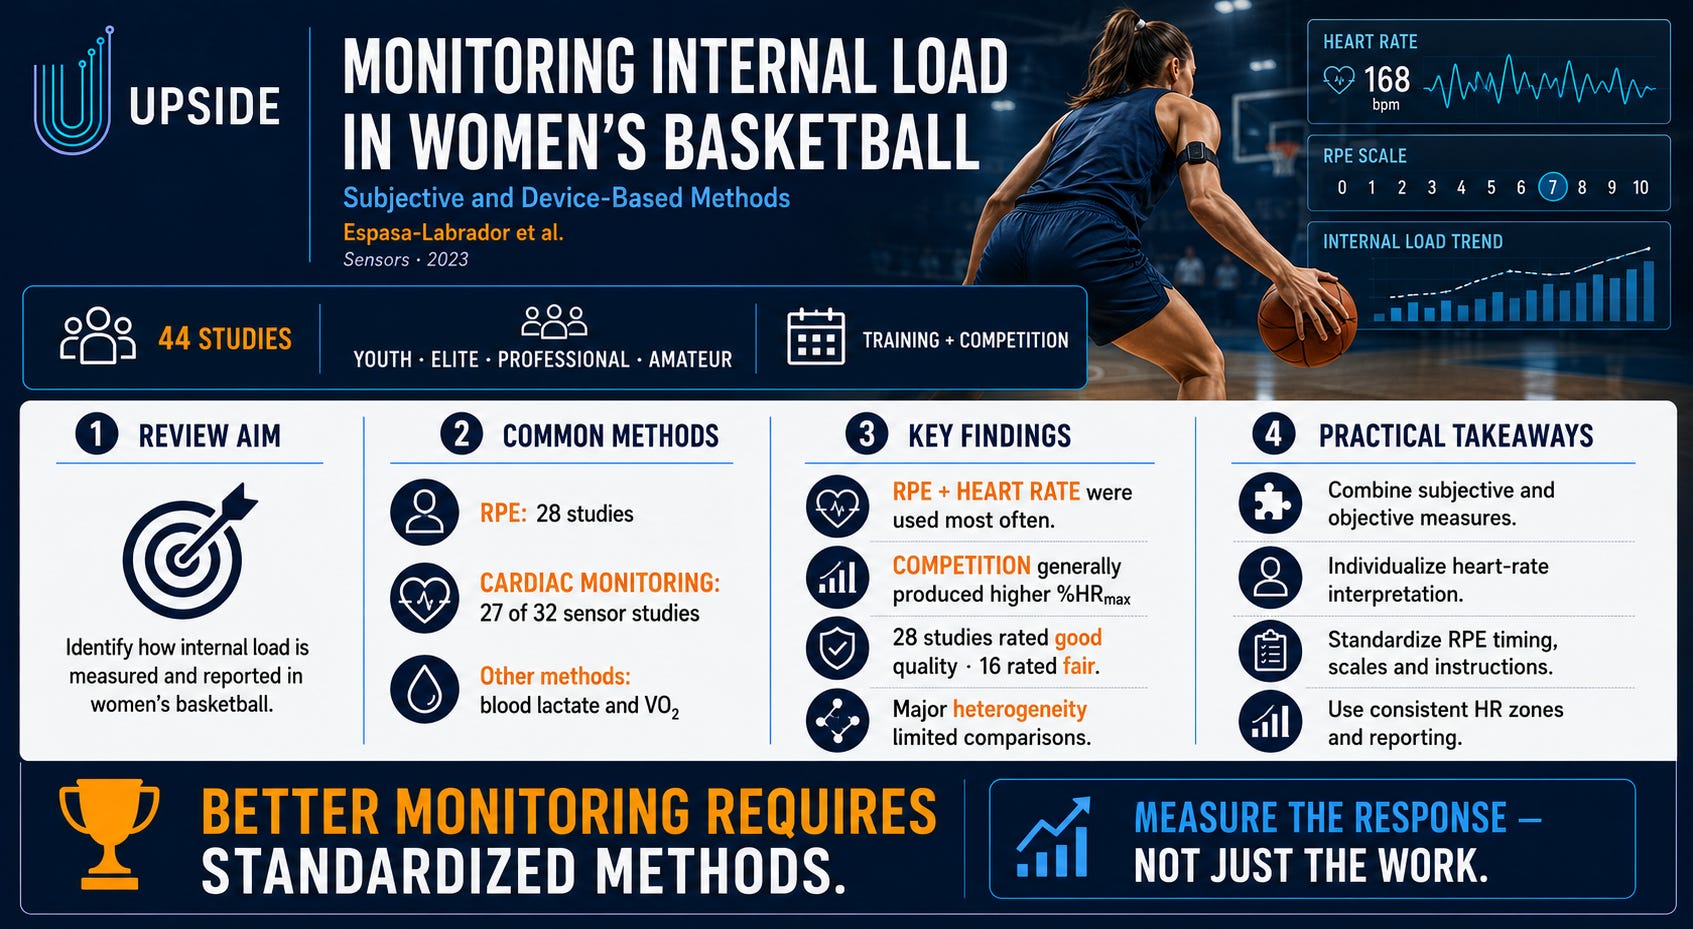
🏀 Upside Women’s Basketball Study: Monitoring Internal Load Through Subjective and Device-Based Methods
Published in Sensors (2023) by Javier Espasa-Labrador, Azahara Fort-Vanmeerhaeghe, Alicia M. Montalvo, Marta Carrasco-Marginet, Alfredo Irurtia & Julio Calleja-González.
🧩 Introduction
How should teams measure the physiological and psychological demands placed on women’s basketball players?
External load describes the work an athlete completes. Internal load represents the athlete’s individual response to that work, influenced by factors such as:
Fitness
Fatigue
Motivation
Stress
Age
Experience
Physiological characteristics
Monitoring internal load can help practitioners understand how players respond to training and competition. However, most basketball research has historically focused on men.
This systematic review examined the methods and metrics used to monitor internal load in women’s basketball across different ages and competition levels.
Authors:
Javier Espasa-Labrador
Azahara Fort-Vanmeerhaeghe
Alicia M. Montalvo
Marta Carrasco-Marginet
Alfredo Irurtia
Julio Calleja-González
Institutions represented:
University of Barcelona
Ramon Llull University
Catalan Federation of Basketball
Arizona State University
University of the Basque Country
University of Zagreb
Click on the button below to download the full study:
🧪 Review Overview
Design: Systematic review conducted according to PRISMA guidelines.
Search period: All relevant studies published through January 31, 2023.
Databases:
EBSCO
PubMed
Scopus
Web of Science
Selection process:
503 records initially identified
294 duplicates removed
74 full-text articles assessed
37 studies met the initial criteria
Seven additional studies identified through reference searching
44 studies included in the final review
Populations included:
Youth players
Elite players
Professional players
Amateur players
Basketball settings:
Training sessions
Competitive games
Simulated games
5-on-5 competition
3-on-3 competition
👥 Populations and Events
Among the 44 included studies:
16 studies included youth players
13 studies monitored professional players
12 studies included amateur players
Multiple studies examined elite players
One study did not specify the competition level
Regarding the events monitored:
19 studies examined training only
14 studies examined competition only
11 studies examined both training and competition
The review therefore covered a broad population, but differences in age, competitive level, game format and monitoring protocol contributed to considerable variation among studies.
📊 Internal-Load Monitoring Methods
📝 Rating of Perceived Exertion
RPE was the most frequently used subjective method:
28 studies used RPE
Training RPE values ranged from approximately 2.9 to 7 arbitrary units
Competition values generally showed a narrower range
Session load values ranged from approximately 253 to 942 arbitrary units
Some studies recorded the player’s RPE score directly. Others calculated session RPE by multiplying the score by session duration.
Collection methods included:
Mobile applications
Computers
Paper and pencil
However, relatively few studies clearly reported:
The exact question asked
When RPE was collected
Whether responses were private
How players were familiarized with the scale
Whether players rated the entire session or a specific task
❤️ Heart-Rate Monitoring
Of the 32 studies using sensor-based methods:
27 monitored cardiac response
Heart rate was the dominant device-based method
Metrics included:
Average heart rate
Maximum and minimum heart rate
Percentage of maximum heart rate
Percentage of average heart rate
Time spent in different heart-rate zones
Banister’s training impulse
Summated heart-rate zones
Only four studies provided complete information about:
Device manufacturer
Sampling frequency
Sensor placement
This incomplete reporting made it difficult to compare results across teams and studies.
🩸 Other Physiological Methods
Less commonly used methods included:
Blood lactate concentration
Oxygen consumption
Estimated calorie expenditure
Blood lactate during competition generally ranged from approximately 3.2 to 6.0 mmol/L, indicating a meaningful glycolytic contribution to basketball activity.
Only one study reported oxygen consumption during games:
33.4 ± 4.0 mL/kg/min
Approximately 66.7% of VO₂max
These methods may provide valuable information but are less practical because they require specialized equipment, expertise or invasive collection.
📈 Key Findings
RPE and Heart Rate Dominated the Literature
The two most commonly used approaches were:
Subjective RPE monitoring
Device-based heart-rate monitoring
Both methods can be practical, relatively accessible and useful for longitudinal monitoring. However, each has important methodological limitations.
Competition Generally Produced a Higher Relative Cardiac Demand
The review reported:
Training average heart rate: 127.9–183.2 bpm
Competition average heart rate: 144.1–145.9 bpm
Reported training intensity: approximately 72.95% HRmax
Competition intensity: generally above 81.2% HRmax
During official competition, players commonly spent substantial time above 85% of maximum heart rate.
However, the authors cautioned that differing protocols, populations and heart-rate zones limit direct comparison.
Game Format Influenced Internal Load
Different formats produced different physiological demands.
In one comparison:
Players in 3-on-3 basketball spent approximately 85% of playing time above 95% HRmax
Players in 5-on-5 basketball spent less than 10% of playing time in that same zone
The additional space, fewer players and fewer interruptions in 3-on-3 competition may create a more intense physiological demand.
These findings should be interpreted cautiously because they were drawn from studies using different methodologies.
Study Quality Was Generally Acceptable
Using the STROBE reporting checklist:
28 studies were rated good quality
16 studies were rated fair quality
No studies were classified as poor quality
Agreement between reviewers was strong, with a Cohen’s kappa of 0.863.
Heterogeneity Was the Central Problem
The review’s most important finding was the lack of standardized measurement.
Studies differed in their use of:
RPE scales
RPE questions
Collection timing
Session-duration calculations
Heart-rate zones
Maximum-heart-rate estimation
Sensor types and placement
Individual versus team averages
Training and competition exposure time
This heterogeneity prevented the authors from establishing reliable normative values or making strong comparisons between age groups, competition levels and events.
🧠 Implications for Women’s Basketball
The review suggests that no single metric provides a complete picture of internal load.
RPE is inexpensive and non-invasive, making it especially practical for teams with limited budgets or restrictions on wearable technology during games. However, subjective responses can be influenced by player understanding, question wording and data-collection procedures.
Heart-rate monitoring provides objective information about cardiovascular demand, but it may respond slowly to short, explosive basketball actions. It also requires individualized interpretation.
Internal load should therefore be evaluated alongside:
External workload
Playing time
Drill type
Game format
Competitive level
Player age
Individual fitness
Training and competition context
📌 Recommendations
For Coaches and Performance Staff
Combine RPE with an objective measure such as heart rate.
Monitor players individually rather than relying only on team averages.
Separate training and competition data.
Account for actual participation and useful playing time.
Interpret internal load alongside external workload.
Familiarize players with subjective monitoring methods.
For RPE Monitoring
Use a consistent scale and question.
Define whether players are rating intensity, fatigue or discomfort.
Collect responses at a consistent time.
Clarify whether the rating covers a drill or the entire session.
Obtain responses privately when possible.
Avoid directly comparing session loads with very different durations.
For Heart-Rate Monitoring
Report the device, sampling rate and sensor location.
Explain how maximum heart rate was established.
Use individual percentages rather than only absolute heart-rate values.
Standardize the number and boundaries of heart-rate zones.
Report time spent within each zone.
Consider the delay between explosive activity and cardiovascular response.
For Researchers and Technology Companies
Develop standardized monitoring protocols.
Improve objective, practical and non-invasive measurement tools.
Validate methods specifically in female basketball populations.
Include external load as context for internal responses.
Examine physiological considerations specific to women athletes.
Develop clearer normative values by age and competition level.
⚠️ Limitations
The review identified several limitations in the available research:
Major variation existed across monitoring methods and metrics.
Many studies did not report the training or competition dose clearly.
Device specifications were often incomplete.
Methods for estimating maximum heart rate were poorly described.
RPE timing and instructions were frequently omitted.
Studies differed substantially in age and competition level.
Training, 3-on-3 and 5-on-5 data were not always directly comparable.
External load was not consistently included as contextual information.
Limited evidence was available for blood lactate and oxygen consumption.
The review was descriptive and did not establish causal relationships.
These limitations prevented the researchers from recommending a single definitive monitoring system.
✅ Conclusion
This systematic review found that RPE and heart-rate monitoring are the most common methods for quantifying internal load in women’s basketball.
Both approaches provide useful information, but inconsistent measurement and reporting practices make comparisons across studies difficult.
The authors recommend combining subjective and objective measures, interpreting results at the individual level and adopting standardized protocols for RPE collection, heart-rate zones, device reporting and exposure time.
The central takeaway: collecting more data is not enough—women’s basketball needs consistent, individualized and context-specific internal-load monitoring.
You may also like:
📖 Upside Analysis: Shockwave Therapy Vs Laser Therapy in Elite Sports: Key Differences, Stats, Studies, Vendors, Case Studies, Best Practices

Extracorporeal shockwave therapy (ESWT) and laser therapy (photobiomodulation, PBM/LLLT) are two non-invasive modalities used across elite sport to reduce pain, accelerate tissue remodeling, and support availability. Though both can help similar clinical pictures (e.g., plantar fasciitis, Achilles/patellar tendinopathy), they operate through different p…
📚 Upside Studies: (1) Soccer Study: Load, Temperature, Well-Being Link. (2) Study: VR Assessment in Neurorehabilitation (3) Study: Youth Football Dropout Factors

⚽ Upside Study (1): Association Between Physical Demands, Skin Temperature, and Well-Being Status in Elite Football Players