
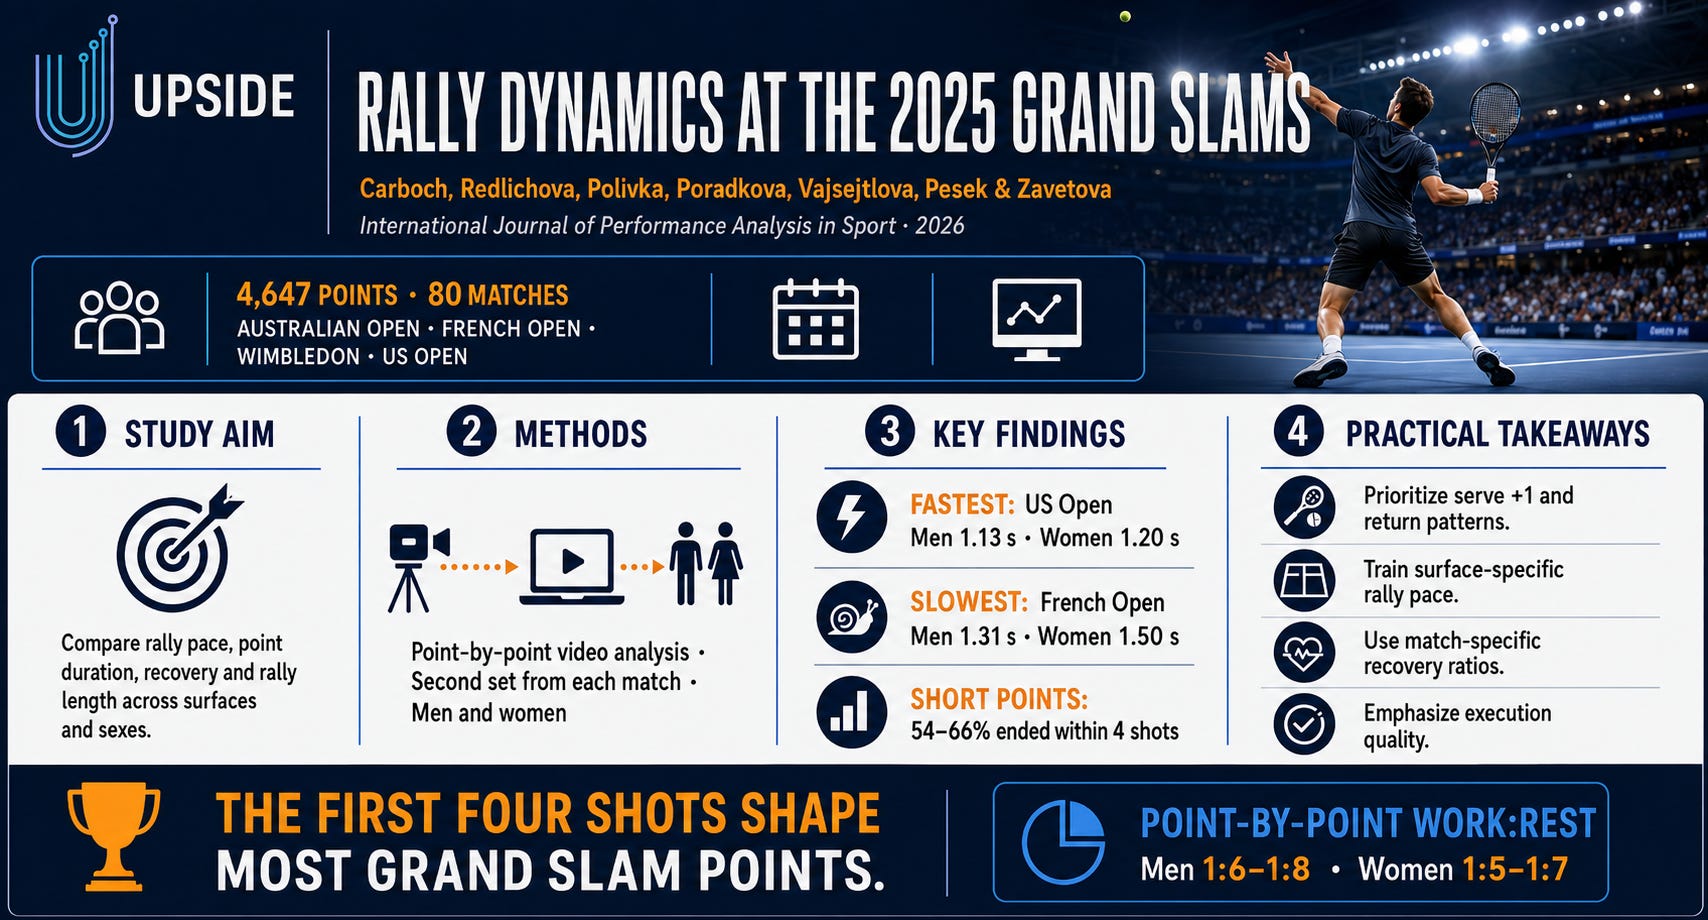
🎾 Upside Tennis Study: Rally Dynamics and Match Characteristics at Grand Slam Tournaments
Published in International Journal of Performance Analysis in Sport (2026) by Jan Carboch, Vendula Redlichova, Tomas Polivka, Katerina Poradkova, Tereza Vajsejtlova, Dominik Pesek & Lucie Zavetova.
🧩 Introduction
How much do court surface and sex influence the pace, duration and physical demands of elite tennis rallies?
This study analyzed men’s and women’s matches from all four 2025 Grand Slam tournaments. The researchers compared rally pace, point duration, time between points, number of shots and work-to-rest ratios.
The findings show that Grand Slam tennis is highly surface-specific. The US Open produced the fastest rally pace, while the French Open produced the slowest. Yet across every tournament, most points were decided quickly: 54–66% ended within the first four shots.
Authors:
Jan Carboch
Vendula Redlichova
Tomas Polivka
Katerina Poradkova
Tereza Vajsejtlova
Dominik Pesek
Lucie Zavetova
Institution:
Faculty of Physical Education and Sport, Charles University, Prague, Czech Republic
Download the full study by clicking on the button below:
🧪 Study Overview
Design: Observational, point-by-point video analysis of elite Grand Slam matches.
Tournaments:
Australian Open
French Open
Wimbledon
US Open
Study period: 2025 Grand Slam season.
Sample:
4,647 points
80 matches
10 men’s and 10 women’s matches from each tournament
Only the second set of each match was analyzed
Variables measured:
Point duration
Number of rally shots
Time between points
Rally pace
Work-to-rest ratio
Rally pace was calculated by dividing point duration by the number of shots. Work-to-rest ratios were calculated for each individual point rather than from match-level averages, allowing a more precise representation of match demands.
Reliability: Inter-rater reliability ranged from ICC 0.89–1.00, while intra-rater reliability ranged from ICC 0.93–1.00.
📊 Typical Match Characteristics

Lower rally-pace values indicate less time between opposing racket contacts and therefore faster play.
📈 Key Findings
⚡ The US Open Produced the Fastest Rally Pace
Rally pace was fastest at the US Open for both groups:
Men: 1.13 seconds per shot
Women: 1.20 seconds per shot
For men, the US Open was significantly faster than the French Open, Wimbledon and Australian Open. For women, it was faster than the other tournaments by effect-size comparisons, while the French Open was significantly slower than all three.
This suggests that players at the US Open faced the greatest time pressure during rallies.
🧱 The French Open Produced the Slowest Rally Pace
Clay at the French Open produced the slowest rally pace:
Men: 1.31 seconds per shot
Women: 1.50 seconds per shot
Men also played the most shots per rally at the French Open, averaging 7.55, compared with 5.35 at Wimbledon and 5.87 at the US Open.
The slower, higher bounce of clay gives players more time to retrieve balls and can extend rallies. Surface-related differences in rally length were much clearer in men’s matches than women’s matches.
🎯 Most Points Were Decided Within Four Shots
The percentage of points completed within the first four shots was:

Across the four tournaments, 54–65% of men’s points and 59–66% of women’s points ended within four shots.
This means that nearly two-thirds of points were often decided within two shots per player, emphasizing the importance of:
The serve
The return
Serve-plus-one patterns
Return-plus-one patterns
Early-rally positioning and decision-making
👨 Men Generally Played at a Faster Rally Pace
Men exhibited a faster rally pace than women overall. Tournament-specific statistically significant differences were found at:
French Open: men 1.31 s vs. women 1.50 s
US Open: men 1.13 s vs. women 1.20 s
The largest differences between men’s and women’s match characteristics appeared at the French Open. No statistically significant gender differences were found at Wimbledon, suggesting that grass produced the most similar match dynamics.
Even small differences in available time can influence preparation, perception, positioning and whether a player can execute an offensive rather than defensive shot.
👩 Women’s Rally Length Was More Consistent Across Surfaces
Women averaged between 4.27 and 4.45 shots per rally at all four tournaments, with no significant tournament effect.
Men ranged from 5.35 shots at Wimbledon to 7.55 at the French Open, showing greater surface-related tactical variation.
The researchers also observed that women tended to use a relatively consistent, aggressive, return-oriented strategy across surfaces. On clay, women appeared more likely than men to finish points with the return shot.
⏱️ Wimbledon Had the Shortest Breaks Between Points
Time between points was shortest at Wimbledon:
Men: 20.0 seconds
Women: 20.1 seconds
At the other Grand Slams, men averaged 24.4–26.6 seconds, while women averaged 23.2–23.6 seconds.
This faster overall rhythm may reflect shorter rallies, lower recovery demands and the distinctive movement demands of grass, although weather and other contextual factors may also contribute.
🔋 Work-to-Rest Demands Were Higher Than Previously Reported
Point-by-point calculations produced typical work-to-rest ratios of:
Men: approximately 1:6 to 1:8
Women: approximately 1:5 to 1:7
Selected tournament values included:
Men at the US Open: 1:7.55
Men at the French Open: 1:5.93
Women at the US Open: 1:6.60
Women at the French Open: 1:4.60
These ratios reflect more rest per unit of work than the commonly cited 1:2 to 1:5 range. The authors argue that point-by-point analysis provides a more accurate estimate than dividing averaged match-level work and recovery values.
🧠 Implications for Tennis Coaches and Practitioners
The study reinforces that training should reflect the actual demands of the tournament and surface.
Players preparing for the US Open may need drills that reproduce faster rally pace and reduced decision time. French Open preparation may require greater tolerance for longer rallies, especially in men’s tennis, together with tactical patience and efficient movement on clay.
At every tournament, however, the opening four shots remain critical. Training volume alone is not enough; coaches should prioritize the quality, placement and tactical intent of serves, returns and the next shot.
📌 Recommendations
For Technical and Tactical Training
Prioritize serve-plus-one and return-plus-one patterns.
Train serve placement and the quality of the next shot.
Develop aggressive but controlled return strategies.
Practice early-rally decision-making under realistic time pressure.
Include longer rallies to preserve match-like variability.
For Surface-Specific Preparation
Reproduce the faster rally pace expected at the US Open.
Prepare for longer men’s rallies and slower pace on French Open clay.
Train movement, balance and abbreviated preparation for grass.
Adjust tactical expectations by surface rather than using one uniform match model.
For Conditioning and Recovery
Use point-by-point work-to-rest ratios when designing drills.
Target approximately 1:6–1:8 for men and 1:5–1:7 for women, while adapting to the player and tournament.
Emphasize high-quality execution rather than accumulating excessive repetitions.
Include adequate recovery so technical quality is maintained during high-intensity drills.
For Performance Analysis
Analyze rally pace rather than relying only on rally length.
Separate men’s and women’s demands where meaningful.
Evaluate point-ending patterns by surface.
Account for weather, opponent, playing style and tactical context when interpreting tournament averages.
⚠️ Limitations
The authors identified several limitations:
Only 80 matches were analyzed.
Only the second set of each match was included.
Points were treated as independent even though they were nested within games and matches.
Weather, ball characteristics, scoreline, player style, opponent quality, fatigue and mental state were not controlled.
Matches were selected partly according to video availability and quality.
Findings represent elite Grand Slam players and may not generalize to junior or lower-ranked players.
Future research should use hierarchical or mixed-effects models, examine full-match progression and compare elite results with junior and lower-ranked populations.
✅ Conclusion
This study demonstrates that rally dynamics vary meaningfully across Grand Slam tournaments and between men’s and women’s tennis.
The US Open created the fastest rally pace, while the French Open created the slowest. Men’s rally length varied substantially by surface, whereas women maintained a more consistent pattern across tournaments. Point-by-point analysis also suggested that elite tennis provides more recovery relative to playing time than conventional averaged estimates imply.
Above all, most points ended within four shots. Coaches should therefore build preparation around surface-specific time pressure, realistic recovery and high-quality serve, return and early-rally combinations.
The central takeaway: at Grand Slam level, the first four shots shape most points.
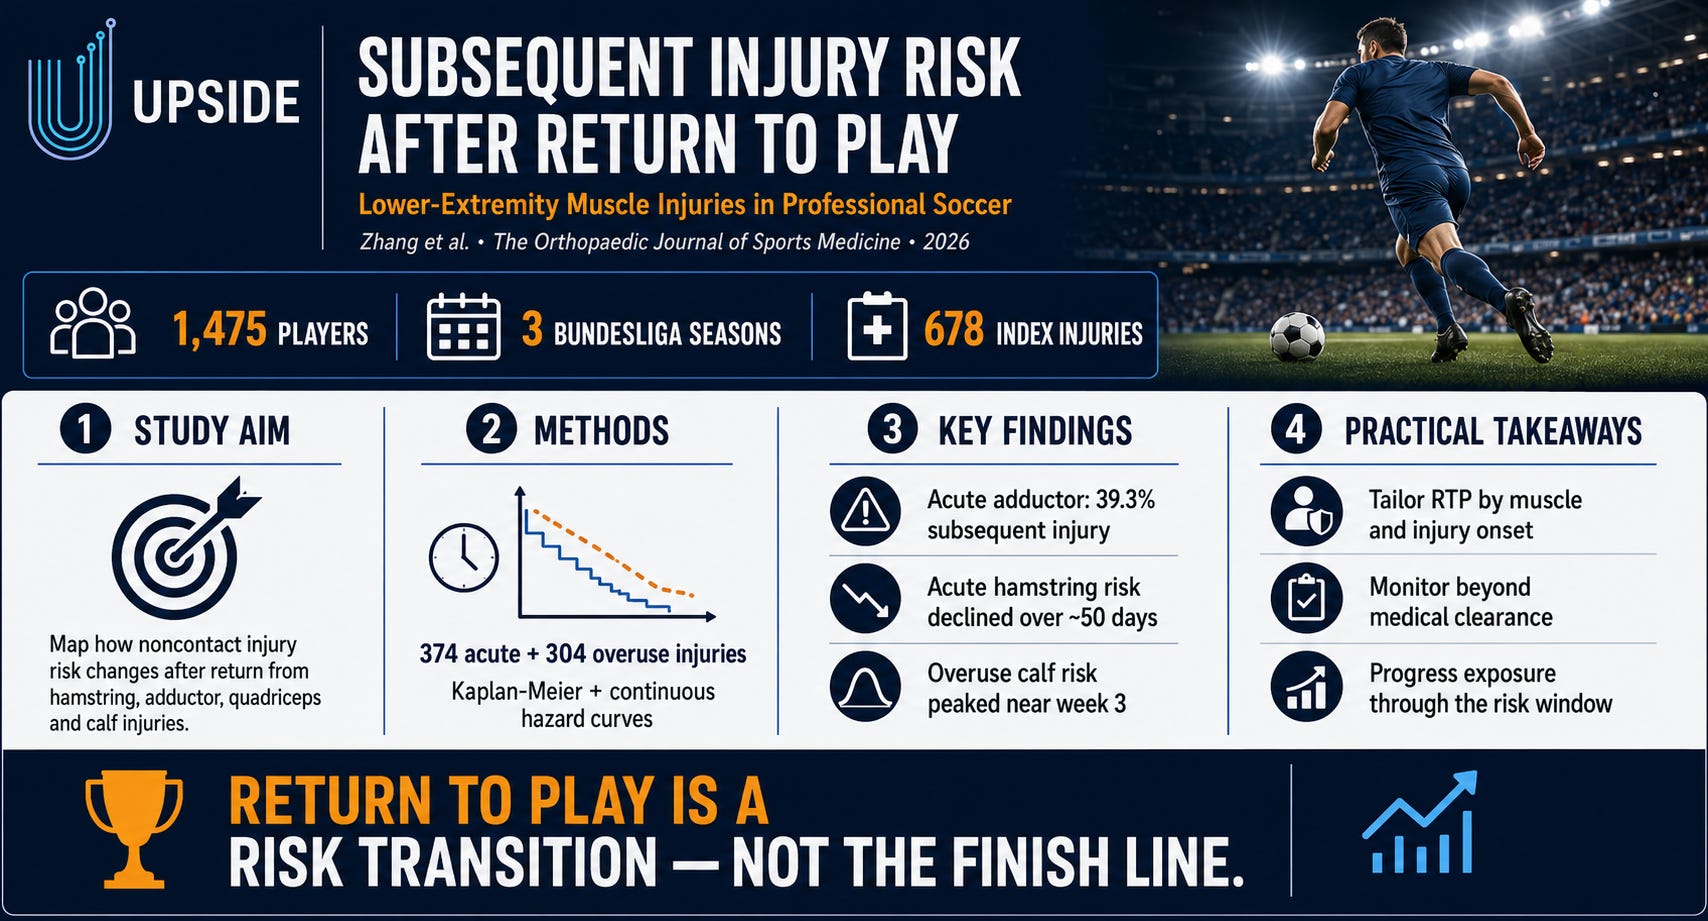
⚽ Upside Soccer Study: Subsequent Injury Risk After Return to Play From Lower-Extremity Muscle Injuries
Published in The Orthopaedic Journal of Sports Medicine (2026) by Guangze Zhang, Michel S. Brink, Dominik Szymski, Lorenz Huber, Werner Krutsch, Volker Alt, Karen aus der Fünten, Tobias Tröß, Tim Meyer, Koen A.P.M. Lemmink & Anne Hecksteden.
🧩 Introduction
When a professional soccer player returns from a lower-extremity muscle injury, how does the risk of another injury change over time?
This study shows that the answer depends on which muscle was injured and whether the original injury was acute or caused by overuse.
Researchers followed professional male players from Germany’s first and second Bundesliga across three seasons. They examined noncontact, time-loss injuries after players returned to full training and competition following hamstring, quadriceps, adductor or calf injuries.
The findings demonstrate that subsequent-injury risk is not constant. Acute hamstring, adductor and quadriceps injuries carried greater risk immediately after return to play, while overuse calf injuries produced a delayed peak approximately three weeks later.
Authors:
Guangze Zhang
Michel S. Brink
Dominik Szymski
Lorenz Huber
Werner Krutsch
Volker Alt
Karen aus der Fünten
Tobias Tröß
Tim Meyer
Koen A.P.M. Lemmink
Anne Hecksteden
Institutions:
Saarland University
University of Groningen / University Medical Center Groningen
University Medical Centre Regensburg
FIFA Medical Centre of Excellence, University Medical Centre Regensburg
Stuttgart University
University of Innsbruck
Medical University of Innsbruck
Download the full study by clicking on the button below:
🧪 Study Overview
Design: Prospective injury surveillance with descriptive time-to-event analysis.
Competition: First and second German Bundesliga.
Study period: Three consecutive seasons, from 2022–23 through 2024–25.
Participants:
1,475 professional male players across the study period
796 players from 23 clubs in 2022–23
881 players from 27 clubs in 2023–24
748 players from 23 clubs in 2024–25
Injury dataset:
1,640 total injuries
678 hamstring, adductor, quadriceps or calf injuries included as index injuries
374 acute injuries
304 overuse injuries
635 of the 678 included injuries were evaluated with ultrasound and/or MRI after clinical examination
Return to play: Full availability for team training and competition.
Subsequent injury: A noncontact, time-loss injury occurring in the same season after return to play. This included both recurrent injuries at the same site and new injuries elsewhere.
Medical teams classified each index injury as:
Acute: sudden onset without a repetitive mechanism
Overuse: gradual onset and/or related to repetitive microtrauma
The researchers used Kaplan-Meier survival analysis and cubic-spline modeling to estimate continuous subsequent-injury risk during the first 100 days after return to play.
📊 Observed Subsequent-Injury Rates

These percentages describe observed noncontact subsequent injuries during the same season. They should not be interpreted as causal effects or as the probability of reinjuring the original muscle specifically.
📈 Key Findings
🚨 Risk After Return to Play Was Time-Varying
The risk of a subsequent injury changed throughout the weeks following return to play rather than remaining constant.
After acute hamstring, adductor and quadriceps injuries, risk was elevated soon after the player returned. It then generally declined during the first several weeks.
This means a player being medically cleared does not mark the end of risk management. The early post-return period remains a distinct transition phase requiring individual monitoring and progressive exposure.
🦵 Acute Adductor Injuries Had the Highest Observed Rate
Of the 84 acute adductor injuries, 33 were followed by a noncontact subsequent injury, an observed rate of 39.3%—the highest among the acute injury groups.
Risk shortly after return was approximately twice the later baseline level, fell by roughly half within four weeks and then remained comparatively low, although the curve showed a modest later rise around three months.
Only three of the 33 subsequent injuries were recurrences. The result therefore reflects broader vulnerability after the original injury, not simply repeated adductor injury.
⏳ Acute Hamstring Risk Declined More Gradually
After 154 acute hamstring injuries, 43 players sustained a subsequent injury (27.9%).
The elevated risk declined steadily over approximately 50 days. The study’s conclusion characterized this risk as diminishing within roughly 12 weeks before leveling off.
Hamstring injuries also had the largest recurrence component among acute injuries:
18 recurrences
41.9% of all observed subsequent injuries after acute hamstring injury
This may partly explain why the hamstring risk curve declined more slowly than the curves following acute adductor and quadriceps injuries.
📉 Acute Quadriceps Risk Fell Sharply in the First Month
After acute quadriceps injury, 22 of 84 cases were followed by a subsequent injury (26.2%).
Risk was elevated immediately after return but dropped substantially during the first four weeks. A small temporary increase followed later.
Only two subsequent injuries were quadriceps recurrences, emphasizing that monitoring should consider the player’s whole-body injury risk rather than only the previously injured site.
🐄 Acute Calf Risk Was Lower and More Stable
Acute calf injuries produced the lowest observed subsequent-injury rate:
11 subsequent injuries among 52 cases
21.2%
No recurrences observed
Unlike the other acute groups, risk was relatively low during the first days after return and remained comparatively stable across the post-return period.
⏰ Overuse Calf Injuries Produced a Delayed Risk Peak
The most distinctive overuse pattern occurred after calf injury. Rather than peaking immediately, subsequent-injury risk rose to a peak around three weeks after return to play.
Although it declined afterward, risk remained higher than for the other overuse groups until approximately day 50.
This finding suggests that an apparently successful first week back may not indicate that the vulnerable period has passed. Accumulating training and match exposure may reveal risk later in the return process.
🔄 Overuse Hamstring and Quadriceps Risk Was Highest Early
Overuse hamstring and quadriceps injuries followed similar trajectories. Risk was relatively elevated when players returned to full availability, reached its lowest level within approximately one month and then fluctuated modestly.
Observed subsequent-injury rates were similar:
Overuse hamstring: 28.1%
Overuse quadriceps: 27.7%
The recurrence share was 29.6% after overuse hamstring injuries and 16.7% after overuse quadriceps injuries.
📍 Similar Overall Rates Can Hide Different Risk Windows
The four overuse groups had nearly identical observed subsequent-injury rates—between 27.2% and 28.1%—and their survival curves were not significantly different (P = .98).
However, their hazard curves differed in timing. Overuse calf injuries showed a delayed peak, while overuse hamstring and quadriceps injuries showed higher risk immediately after return.
This is one of the study’s most practically important findings: an average percentage alone cannot show when a player is most vulnerable.
🧠 Implications for Soccer Teams and Practitioners
Return-to-play decisions should be specific to the original injury rather than based on one universal post-injury protocol.
The findings support treating full team availability as the beginning of a monitored return-to-performance phase. Medical and performance teams should integrate:
The injured muscle group
Acute versus overuse onset
Tissue healing and functional capacity
Training and match exposure after return
Recurrence risk at the original site
New-injury risk elsewhere in the body
Psychological readiness
The player’s position, movement demands and competitive schedule
The distinction between recurrence and subsequent injury is especially important. Most observed events were not reinjuries of the original muscle. A narrow focus on the healed tissue may therefore miss broader effects of deconditioning, compensatory movement, incomplete restoration of capacity or rapid loading.
📌 Recommendations
For Return-to-Play Decision-Making
Avoid using one standard clearance pathway for all lower-extremity muscle injuries.
Evaluate the injury mechanism, tissue involved, severity and functional role of the muscle.
Combine clinical assessment with strength, running, change-of-direction and football-specific testing.
Assess psychological readiness alongside physical criteria.
Document the rationale and objective criteria used for full clearance.
For Post-Return Load Management
Continue structured monitoring after the player resumes full training and competition.
Progress high-speed running, sprinting, accelerations, decelerations and match minutes deliberately.
Pay particular attention to the first four weeks after acute adductor and quadriceps injuries.
Maintain enhanced monitoring for roughly 50 days after acute hamstring injury.
Watch for a delayed vulnerability period around week three after overuse calf injury.
Coordinate rehabilitation, medical, strength and conditioning, and coaching decisions.
For Injury Surveillance and Analytics
Track both recurrences and all subsequent noncontact injuries.
Analyze risk by time since return rather than relying only on seasonal averages.
Separate acute and overuse index injuries.
Record daily training and match exposure to improve interpretation of post-return risk.
Review each club’s outcomes by injury site and rehabilitation pathway.
⚠️ Limitations
The authors identified several limitations:
The study was observational and descriptive, so it cannot establish causality.
Return to play was defined as full availability, but clubs did not use one standardized set of objective clearance criteria.
Injury grades and severity categories could not be analyzed separately because subgroup sample sizes were limited.
The hazard curves were descriptive and differences between them were not formally tested statistically.
Smaller groups, particularly acute calf injuries, increased the possibility of model overfitting.
Training and match exposure after return was not incorporated into the risk estimates.
End-of-season censoring may have influenced the observed proportion of recurrences.
Occasional transfers out of the league were not explicitly modeled.
Findings may not generalize beyond elite adult male professional soccer, particularly to women, youth or lower-level players.
Future research should include larger samples, standardized return-to-play criteria, daily exposure data and separate analyses of recurrent versus new injuries, injury severity, women’s soccer and youth populations.
✅ Conclusion
This study demonstrates that subsequent-injury risk after return to play is dynamic and injury-specific.
Acute hamstring, adductor and quadriceps injuries produced elevated risk soon after return, with different rates of decline. Acute adductor injuries had the highest observed subsequent-injury rate at 39.3%. Overuse injuries produced more variable trajectories, and overuse calf injuries were notable for a delayed risk peak approximately three weeks after return.
For medical and performance teams, the practical message is clear: full availability should not end the return process. Post-return monitoring, exposure progression and risk management should reflect the injured muscle and mechanism of injury.
The central takeaway: return to play is a risk transition—not the finish line.
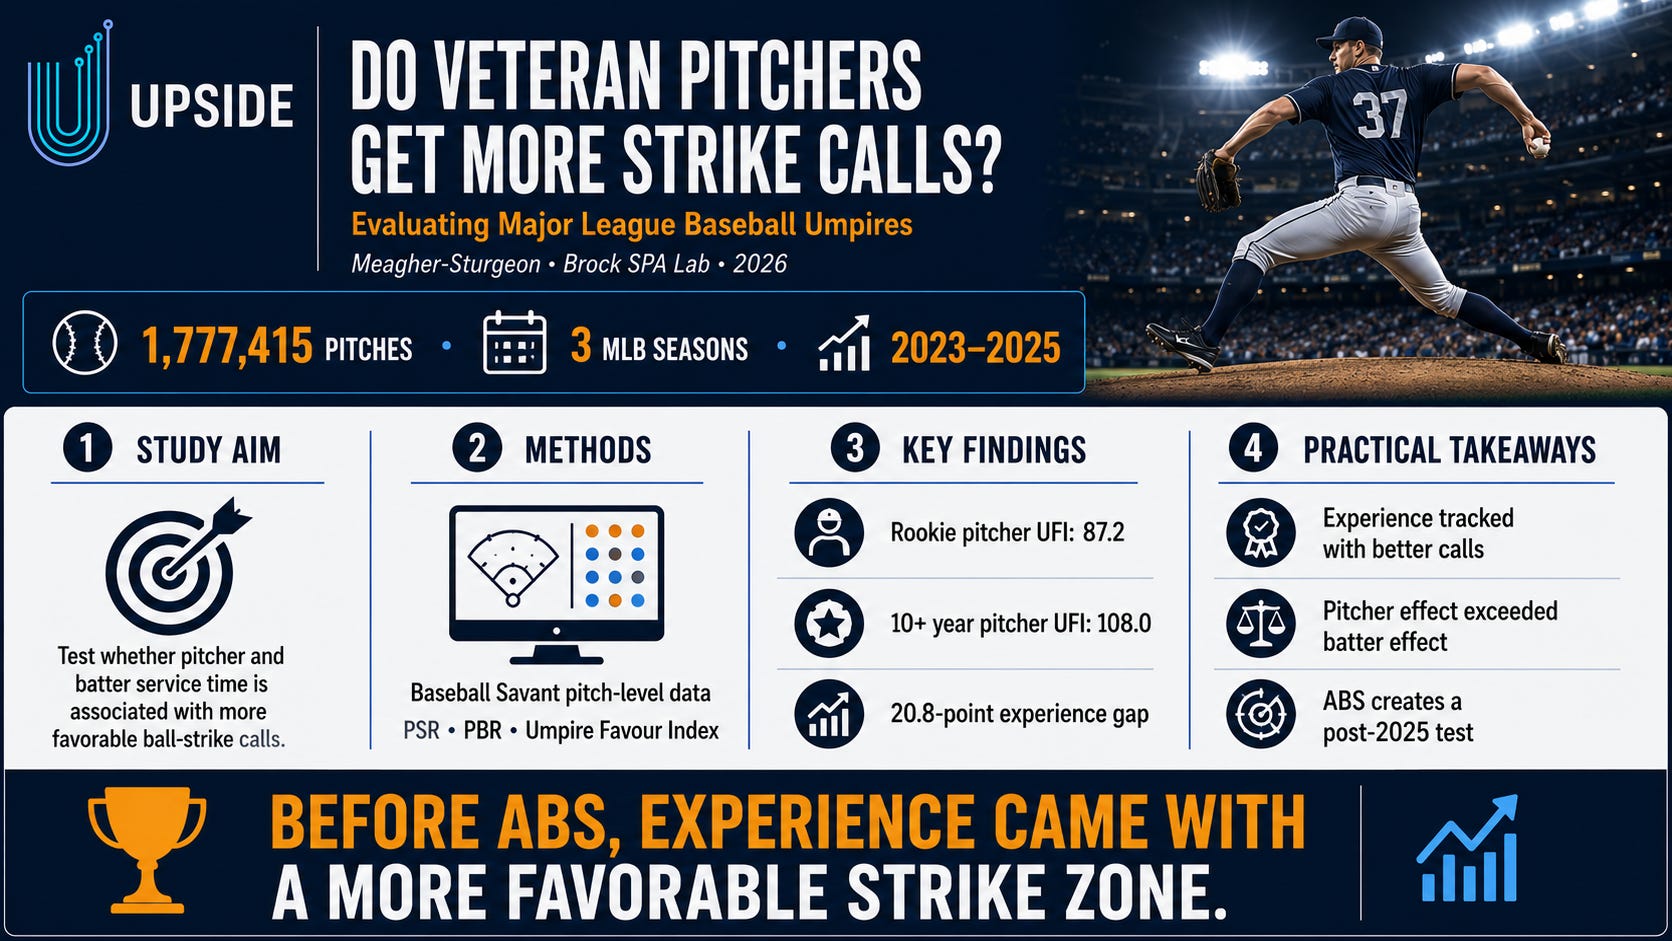
⚾ Upside MLB Study: Do Veteran Pitchers Get More Favorable Strike Calls?
Published by Brock Sport Performance Analytics (SPA) Lab, Volume 1 (2026) by Meagher-Sturgeon.
🧩 Introduction
Do veteran MLB pitchers receive strike calls that younger pitchers do not?
This study examined that question using 1,777,415 pitches from the 2023, 2024 and 2025 MLB regular seasons. It was motivated by pitcher Walker Buehler’s public argument that experienced pitchers have earned favorable calls around the edges of the strike zone.
The analysis found a clear service-time gradient. As pitchers became more experienced, pitches outside the strike zone were called strikes more often, while pitches inside the zone were called balls less often.
Using the study’s Umpire Favour Index, rookie pitchers scored 87.2, compared with 108.0 for pitchers with at least 10 years of service. The difference was much smaller for batters.
Author:
Meagher-Sturgeon
Institution:
Brock Sport Performance Analytics (SPA) Lab
Download the full study by clicking on the button below:
🧪 Study Overview
Design: Retrospective pitch-level observational analysis.
Competition: Major League Baseball.
Study period: 2023–2025 MLB regular seasons.
Sample:
1,777,415 pitches
Pitch-by-pitch data obtained from Baseball Savant
Data scraped and analyzed in R
Pitcher and batter service-time groups:
Rookie: 0–2 years
Early Career: 2–5 years
Veteran: 5–10 years
Elder Statesman: 10+ years
The categories were designed around MLB service-time milestones, including protections available after five years and full pension vesting after 10 years.
Metrics developed by the study:
Phantom Strike Rate (PSR): Percentage of pitches outside the modeled strike zone that were called strikes.
Phantom Ball Rate (PBR): Percentage of pitches inside the modeled strike zone that were called balls.
Phantom Strike Index (PSI): PSR normalized to league average, with 100 representing average.
Phantom Ball Index (PBI): PBR normalized to league average, with 100 representing average.
Umpire Favour Index (UFI): Combined index derived from PSI and PBI. A score above 100 indicates more favorable treatment than league average; below 100 indicates less favorable treatment.
The author used these measures to compare called-strike outcomes across service-time categories for both pitchers and batters.
📊 Pitcher Results by Service Time

The pattern was linear: each increase in service-time category was associated with a higher Phantom Strike Rate, a lower Phantom Ball Rate and a higher Umpire Favour Index.
📈 Key Findings
🧓 Veteran Pitchers Received More Favorable Calls
The Umpire Favour Index increased steadily with pitcher experience:
Rookies: 87.2
Early Career: 96.2
Veterans: 103.8
10+ years: 108.0
Because 100 represents league average, rookie pitchers received 12.8% fewer favorable calls than average under the study’s index, while pitchers with 10 or more years received 8.0% more favorable calls than average.
The gap between the least and most experienced groups was 20.8 index points.
🎯 Experienced Pitchers Earned More Strikes Outside the Zone
Phantom Strike Rate increased with service time:
Rookies: 4.8%
Early Career: 5.5%
Veterans: 6.0%
10+ years: 6.3%
Pitchers with at least 10 years of service therefore received called strikes on out-of-zone pitches 1.5 percentage points more often than rookies.
That represents a relative increase of approximately 31% compared with the rookie rate, although the practical effect on individual pitchers would depend on the number and location of taken pitches.
⚖️ Veteran Pitchers Also Received Fewer Balls Inside the Zone
Phantom Ball Rate moved in the opposite direction:
Rookies: 12.5%
Early Career: 11.8%
Veterans: 11.1%
10+ years: 10.7%
The most experienced pitchers had 1.8 percentage points fewer in-zone pitches called balls than rookies.
The combination of more out-of-zone strikes and fewer in-zone balls drove the steady increase in pitcher UFI.
📉 The Experience Effect Was Much Smaller for Batters

Batter UFI rose only 4.4 points, from 97.6 among rookies to 102.0 among hitters with at least 10 years of service.
The data suggest that experience was associated with favorable treatment for batters too, but the spread was far narrower than for pitchers.
🧢 Reputation May Have Influenced the Human Strike Zone
The study interprets the service-time gradient as evidence that reputation and experience affected pre-ABS umpiring.
Possible mechanisms include:
Greater trust in established pitchers’ command
More consistent glove targets and pitch execution
Veteran pitchers’ ability to work the edges of the zone
Catcher framing and pitcher-catcher familiarity
Umpires’ prior knowledge of pitcher quality or reputation
However, the analysis demonstrates an association rather than proving that reputation itself caused the differences.
🤖 ABS Could Reduce the Veteran Advantage
The author predicts that MLB’s Automatic Ball-Strike challenge system will move UFI values closer to league average by correcting selected missed calls.
Because the system is challenge-based rather than fully automated on every pitch, human umpiring will still shape unchallenged calls. The size of any reduction in the veteran advantage will depend on:
Which players initiate challenges
When teams choose to use them
How many incorrect calls are overturned
Whether service-time differences persist on unchallenged pitches
The 2023–2025 dataset can therefore serve as a useful pre-ABS baseline for future comparisons.
🧠 Implications for MLB Teams and Practitioners
The study raises important questions for analysts, coaches, catchers, pitchers and league officials.
Teams should not assume that the called strike zone has historically been applied identically across players. Service time may be associated with meaningful differences in the calls pitchers receive, particularly on borderline pitches.
For player development departments, younger pitchers may need to demonstrate greater precision before receiving the same benefit on the edges that established pitchers appear to receive. For advance scouting, umpire and catcher tendencies should be examined alongside the pitcher’s command profile and reputation.
The introduction of ABS creates a natural experiment. Comparing service-time groups before and after implementation could reveal whether technology reduces the observed gap or whether some advantage remains in unchallenged calls.
📌 Recommendations
For MLB Analytics Departments
Track called-strike accuracy by pitcher and batter service time.
Separate pitches clearly inside or outside the zone from borderline pitches.
Control for pitch location, count, pitch type, movement and handedness.
Include catcher, umpire, ballpark and game-state effects.
Compare challenged, overturned and unchallenged calls under ABS.
Measure whether the rookie-to-veteran gap changes after implementation.
For Pitching and Catching Development
Prepare young pitchers for a potentially less forgiving called zone.
Emphasize command quality rather than expecting reputation-based calls.
Evaluate how catcher receiving affects different experience groups.
Use video and pitch-location data to identify where favorable calls are gained or lost.
Teach players when an ABS challenge has the greatest expected value.
For MLB and Umpire Evaluation
Monitor whether service-time differences persist after ABS is introduced.
Publish transparent accuracy measures for challenged and unchallenged pitches.
Examine individual-umpire variation rather than relying only on league averages.
Evaluate whether challenge access is distributed fairly across players and situations.
⚠️ Limitations
Several limitations should be considered when interpreting the findings:
The study was observational and cannot establish that pitcher reputation or service time caused favorable calls.
The paper reported descriptive group averages but did not present confidence intervals, hypothesis tests or multivariable models.
Pitch location relative to the edge of the zone was not stratified in the reported results.
Potential confounders—including pitch type, count, velocity, movement, pitcher command, catcher framing, umpire identity, batter handedness, ballpark and game state—were not controlled in the paper.
The dataset contained pitches rather than independent observations; repeated pitches were nested within pitchers, batters, catchers, umpires and games.
The study did not report the number of pitchers or batters in each service-time group.
The custom UFI combines two normalized measures, so its percentage interpretation is specific to the author’s index and should not be treated as a direct percentage of all calls.
Zone classification depends on Baseball Savant’s modeled strike-zone boundaries and may contain measurement error.
The study covers only three seasons immediately before ABS and does not establish whether the relationship existed in earlier eras.
The predicted effects of ABS are prospective and were not tested with post-implementation data.
Future work should use hierarchical regression or mixed-effects models, isolate borderline pitches, control for pitch and game context, and compare the same metrics before and after ABS implementation.
✅ Conclusion
This study provides descriptive evidence that MLB pitchers with more service time received more favorable ball-strike calls from 2023 through 2025.
Pitcher UFI rose consistently from 87.2 for rookies to 108.0 for pitchers with at least 10 years of service, a 20.8-point difference. Veteran pitchers received more strikes outside the modeled zone and fewer balls inside it. A similar pattern appeared for batters, but the difference between rookies and the most experienced group was only 4.4 points.
The results establish a useful pre-ABS benchmark, although further modeling is needed to determine whether experience itself—or factors correlated with experience—explains the pattern.
The central takeaway: before ABS, experience was associated with a more favorable called strike zone—especially for pitchers.
You may also like:
⭐Upside Studies: Genetic profile in genes associated with muscle injuries and injury etiology in professional soccer players

Title: Genetic profile in genes associated with muscle injuries and injury etiology in professional soccer players
📚 Upside Studies: (1) MLB Study: Elbow Surgeries (2) NBA Study: A Comparative Analysis of Jordan's Bulls and Curry's Warriors (3) Soccer Study: Retirement Age

⚾ Upside Study: Epidemiology of Elbow Medial Ulnar Collateral Ligament Surgeries in Major and Minor League Baseball Pitchers