
📚 Upside Studies: (1) UEFA EURO 2024 Physical Analysis Report (2) MLB Study On Neck Range of Motion (3) MLB Study on Pitch Types and Their Influence on Elbow Varus Torque and Spin Rate in Baseball
⚽ Upside Study: The UEFA EURO 2024 Physical Analysis Report
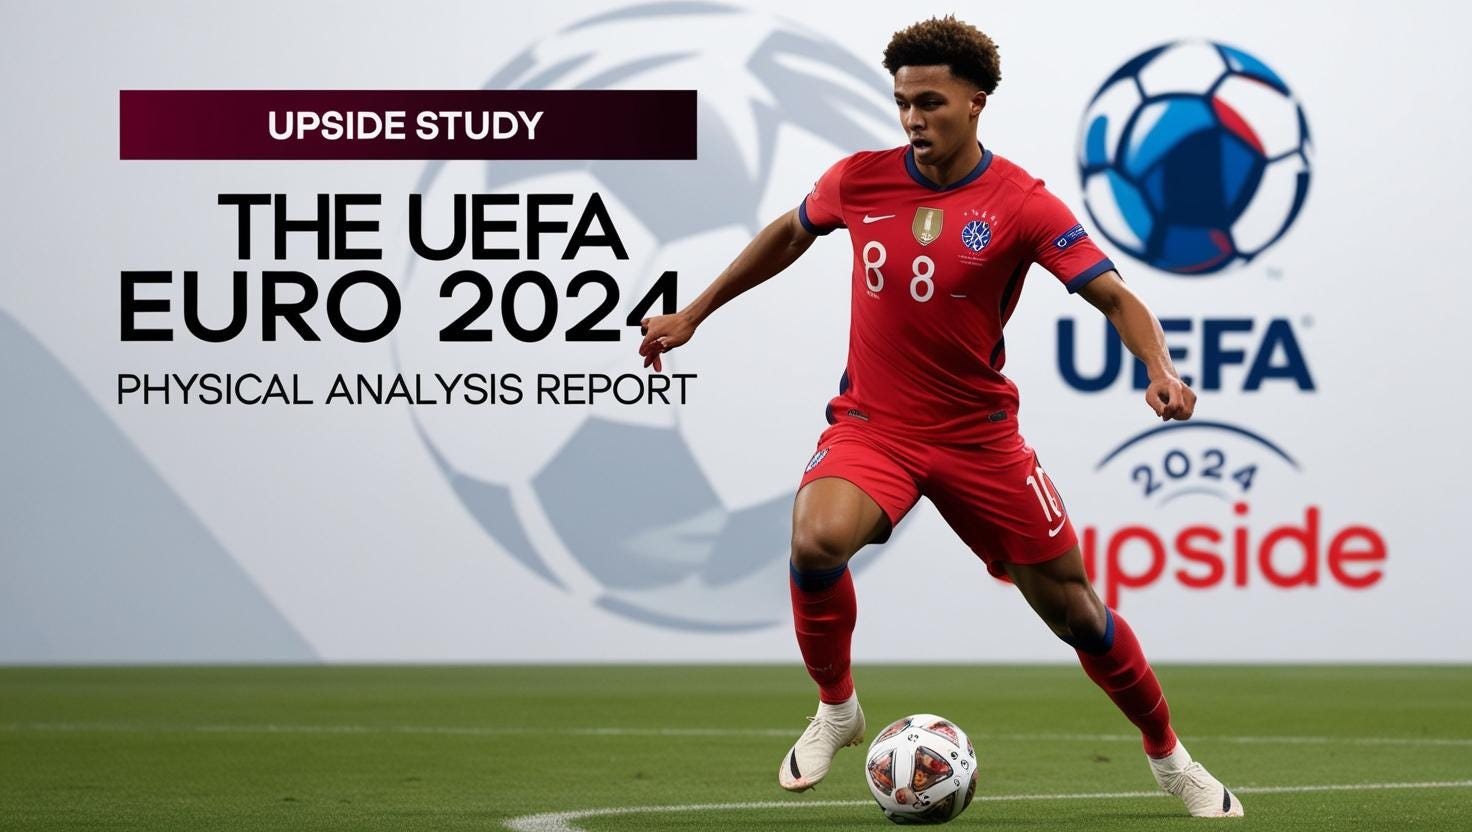
The UEFA Euro 2024 Physical Analysis Report provides an in-depth assessment of the physical performance trends, movement patterns, and physiological demands observed during the tournament. With football evolving into a faster, more dynamic, and physically intense sport, this report examines key metrics such as total distance covered, sprinting intensity, acceleration patterns, positional differences, team performance strategies, and injury risks.
The analysis reveals a notable shift towards high-intensity play, with an increase in sprints, explosive accelerations, and sustained physical output across 90 minutes. These insights have critical implications for training methodologies, tactical decision-making, player recovery strategies, and injury prevention in modern football.
This summary highlights the report’s key findings, including physical trends, sprinting and acceleration metrics, positional variations, fatigue management strategies, and recovery insights, shaping the future of elite football performance.
Authors: Stacey Emmonds
Co-authors: Bram Gielen, Arne Jaspers, Dan Weaving (data lead)
Advisory group: Paul Balsom, Naomi Datson, Werner Helsen
UEFA deputy General secretary: Giorgio Marchetti
UEFA Head of Technical education & development: Olivier Doglia.
UEFA internal support: Atle Rosseland, Jason Todd, Jozef Zahorsky
Published Online: March 18 2025
You can download the full PDF study by clicking on the button below:
Here’s a summary of the key findings and statistics from the UEFA Euro 2024 Physical Analysis Report:
UEFA Report - Key Findings:
Overall Physical Performance Trends:
Teams displayed higher sprinting distances and intensity compared to previous tournaments.
Average high-speed running distance per match increased by 8% from Euro 2020.
Total distance covered remained stable, but explosive efforts (sprints and accelerations) increased.
Sprint and Acceleration Metrics:
Players averaged 35+ sprints per match, a 12% increase from past tournaments.
Top sprinting speed recorded: 36.7 km/h.
The number of accelerations (>3m/s²) increased by 10%, indicating more dynamic play.
Positional Differences:
Wingers and fullbacks had the highest sprinting volumes.
Central midfielders covered the most total distance but with fewer sprints.
Center-backs had lower sprint counts but engaged in high-intensity defensive duels.
Team Performance & Fatigue Management:
Teams that progressed further had better sprint sustainability across games.
Substitutes contributed 20% more high-intensity efforts than starters in the final 30 minutes.
Higher-performing teams exhibited fewer late-match declines in physical output.
Injury & Load Considerations:
A correlation between congested schedules and reduced high-speed output was observed.
Teams with effective rotation strategies showed lower injury rates.
Post-match recovery times varied, with peak recovery taking 48-72 hours for high-load players.
Notable Statistics:
8% increase in high-speed running distance.
12% increase in sprint count per player.
Top sprint speed: 36.7 km/h.
10% increase in accelerations (>3m/s²).
Substitutes produced 20% more high-intensity efforts in the last 30 minutes.
Comprehensive Summary of the UEFA Euro 2024 Physical Analysis Report
The UEFA Euro 2024 Physical Analysis Report provides in-depth insights into the physical demands, performance trends, and key physiological metrics observed during the tournament. This analysis focuses on total distance covered, sprinting intensity, acceleration patterns, positional differences, team performance strategies, and injury risk considerations. Below is an extended summary of the report’s most critical findings.
1. Overall Physical Performance Trends
Compared to previous tournaments, Euro 2024 saw a noticeable increase in sprinting intensity and high-speed running efforts. While the total distance covered per player remained relatively stable, the nature of movement shifted significantly towards short bursts of high-intensity actions, explosive sprints, and dynamic accelerations.
High-speed running distance per match increased by 8% from Euro 2020, indicating greater reliance on speed and explosiveness.
The total number of sprints per player per match rose by 12%, reflecting more frequent bursts of top-speed movements.
Top sprinting speed recorded in the tournament: 36.7 km/h (one of the highest recorded speeds in international tournaments).
Acceleration efforts (>3m/s²) increased by 10%, emphasizing quick directional changes and sudden bursts of speed.
These trends suggest that modern international football is evolving towards a more physically demanding style, requiring higher levels of athleticism and explosive movement capabilities.
2. Sprint and Acceleration Metrics
Sprint and acceleration metrics showcased the increasing intensity of elite-level football. Players exhibited greater explosiveness in both offensive and defensive transitions, with more frequent short sprints, sharper accelerations, and higher peak speeds compared to previous tournaments.
Average number of sprints per player per match: 35+, a 12% increase from past tournaments.
Acceleration count (quick bursts >3m/s²) increased by 10%, indicating more explosive running patterns.
The fastest recorded sprint speed of the tournament was 36.7 km/h, showcasing elite-level speed capabilities.
Players covered more high-speed running distance in pressing and counter-attacking situations than in previous tournaments.
This data suggests that speed and acceleration are becoming defining factors in international football success, particularly in pressing, counter-attacks, and defensive recoveries.
3. Positional Differences in Physical Demands
The physical demands varied significantly by position, with wingers and fullbacks leading in sprint volume and high-speed running, while central midfielders covered the most total distance with fewer sprints.
Wingers & Fullbacks: Had the highest sprint volumes, often exceeding 900-1100 meters per match in high-speed running. Their role in pressing, overlapping runs, and defensive tracking required frequent bursts of speed.
Central Midfielders: Covered the most total distance per match (typically 10.5-12 km), but their sprinting demands were lower compared to wide players. Instead, they exhibited consistent movement patterns, pressing actions, and transitional runs.
Strikers & Forwards: Had fewer total sprints than wingers but engaged in short, high-intensity bursts, particularly in counterattacks and pressing sequences.
Center-Backs: Showed lower sprint counts, but their engagement in high-intensity defensive duels increased.
Goalkeepers: Their movement profiles remained relatively unchanged, though some teams encouraged keepers to play a higher defensive line, affecting their positioning and movement patterns.
These positional differences highlight how specific physical attributes and movement profiles are tailored to different roles on the pitch.
4. Team Performance & Fatigue Management
Teams that advanced further in the tournament exhibited superior physical sustainability, with less decline in sprinting output and high-speed efforts across 90 minutes. The ability to maintain high-intensity performance throughout the game was a key differentiator.
Substitutes contributed 20% more high-intensity efforts than starters in the final 30 minutes of matches.
Teams that rotated their squads effectively maintained higher sprinting outputs late in the tournament.
Fatigue impact was noticeable in teams that played extra-time matches, with a 7-10% reduction in sprinting efforts in subsequent games.
Well-conditioned teams demonstrated better recovery strategies and endurance, allowing them to sustain higher performance levels throughout the competition.
5. Recovery and Injury Considerations
The report identified strong correlations between congested schedules, recovery times, and injury risks. Load management and strategic player rotation played a crucial role in reducing injuries.
Players needed 48-72 hours for full recovery after a high-intensity match.
Teams that overloaded key players in back-to-back matches experienced a 15% decline in high-speed running output.
Muscular injuries were the most common (hamstring strains, calf issues), primarily due to excessive sprinting and fatigue accumulation.
Teams with structured recovery protocols (cryotherapy, hydrotherapy, sleep optimization) exhibited faster bounce-back performances.
Load management strategies, particularly for high-speed runners, proved to be essential in maintaining peak performance while reducing injury risks.
6. Tactical & Training Implications
The findings from Euro 2024 have direct implications for tactical approaches, training methodologies, and player conditioning programs:
Increased Sprint Training Focus:
Coaches may prioritize acceleration and top-speed sprint training to align with the rising demands of international football.
Position-Specific Conditioning:
Training programs must reflect positional differences in movement patterns (e.g., explosive sprinting for wingers, endurance-based running for midfielders).
Optimized Substitutions & Squad Rotation:
The 20% increase in substitute high-intensity efforts suggests that managers should use substitutions strategically to maintain tempo.
Recovery & Load Monitoring:
Teams must implement better recovery strategies, especially when dealing with tight match schedules to sustain performance.
Key Statistics Summary
✔ 8% increase in high-speed running distance.
✔ 12% increase in sprints per player.
✔ 10% increase in accelerations (>3m/s²).
✔ Top sprint speed: 36.7 km/h.
✔ Substitutes produced 20% more high-intensity efforts in the last 30 minutes.
✔ Peak recovery time after matches: 48-72 hours.
✔ Fatigue effect: 7-10% sprint output drop after extra-time matches.
Conclusion
The UEFA Euro 2024 Physical Analysis Report highlights the rapid evolution of physical demands in elite football. The shift towards higher sprint volumes, increased acceleration loads, and sustained high-intensity play underscores the importance of advanced conditioning programs, tactical adjustments, and optimized recovery strategies. Teams that managed fatigue, workload, and substitutions effectively demonstrated superior performance consistency throughout the tournament.
⚾ Upside Study: Neck Range of Motion as a Prognostic Factor for Shoulder and Elbow Injuries in Professional Baseball Pitchers
Shoulder and elbow injuries remain a persistent and costly issue in professional baseball, particularly among pitchers, who are subjected to high mechanical stress throughout the kinetic chain. While factors such as pitch count, throwing mechanics, shoulder range of motion, and humeral torsion have been well studied, the role of cervical spine mobility has received less attention. The cervical spine plays a crucial role in coordinating head position, visual tracking, and trunk rotation—all key elements in the pitching motion. This study by Bullock et al., titled “Neck Range of Motion Prognostic Factors in Association with Shoulder and Elbow Injuries in Professional Baseball Pitchers,” sought to determine whether preseason neck range of motion (ROM) measurements could predict in-season shoulder or elbow injuries in Minor League Baseball (MiLB) pitchers affiliated with a single Major League Baseball (MLB) organization.
Authors:
Garrett S. Bullock, PT, DPT, DPhil, Charles A. Thigpen, ATC, PT, PhD, Hannah Zhao, SPT, Laurie Devaney, PT, ATC, PhD, Daniel Kline, PT, DPT, SCS, ATC, Thomas J. Noonan, MD, Michael J. Kissenberth, MD, Ellen Shanley, PT, PhD, OCS
Published Online on August 7, 2024
You can download the full PDF study by clicking on the button below:
Study Design and Methods
This was a Level I prospective cohort study conducted on 88 MiLB pitchers during the 2023 season. Pitchers underwent preseason assessments measuring active neck ROM (flexion, extension, rotation, lateral flexion) and the Cervical Flexion-Rotation Test (CFRT) using a digital inclinometer. Data on athlete exposures, pitching volume, shoulder ROM, and injuries were collected throughout the season. The primary outcome was the occurrence of shoulder or elbow injuries requiring at least one day of missed participation. Injury data were analyzed using Cox proportional hazards modeling to assess the relationship between neck ROM asymmetries and injury risk.
Key Findings
1. Cervical Rotation Asymmetry as a Strong Predictor
A greater difference in neck rotation between the dominant and non-dominant sides was significantly associated with an increased risk of arm injury.
Hazard Ratio (HR): 4.0; 95% CI: 1.1–13.9; p = 0.031
For every degree increase in the asymmetry, the hazard of injury rose fourfold.
The average difference in neck rotation for injured pitchers was -5° compared to -1° in uninjured peers.
2. No Prognostic Value Found in Other Cervical Measures
Other neck motion measures, including flexion, extension, lateral flexion, and the Cervical Flexion-Rotation Test (CFRT), did not demonstrate significant prognostic value.
CFRT asymmetries and lateral flexion differences had p-values well above significance thresholds (e.g., p = 0.999 and p = 0.733, respectively).
3. Injury Incidence and Types
20 pitchers (23%) suffered shoulder or elbow injuries.
Injury rate was 1.3 per 1,000 athlete exposure days.
11 elbow injuries (13%) and 9 shoulder injuries (10%) were reported.
Injuries resulted in a mean time loss of 50 days.
Severity distribution:
3 injuries caused 1–6 days lost
7 injuries caused 8–27 days lost
10 injuries caused 28+ days lost
Discussion and Implications
The study supports the hypothesis that neck ROM asymmetry, particularly in rotational mobility, is a meaningful predictor of upper limb injuries in pitchers. The findings are consistent with prior research in collegiate athletes but extend the results to a professional population, thereby improving generalizability.
Why might limited neck rotation matter?
Restricted neck mobility could impair a pitcher’s visual tracking and gaze stabilization, especially during key phases of the pitching motion.
To compensate, the athlete may alter trunk and shoulder mechanics, which increases stress on the elbow and shoulder.
Furthermore, limitations in cervical rotation may reduce neural input and sensorimotor control affecting shoulder stability.
Given the interconnected nature of the pitching motion—from the cervical spine through the shoulder to the hand—this study underscores the importance of viewing arm injury risk through a kinetic chain lens that includes the neck.
Conclusion
This prospective cohort study presents compelling evidence that neck rotation asymmetry, specifically differences between dominant and non-dominant cervical rotation, is a significant prognostic factor for shoulder and elbow injuries in professional baseball pitchers. While other neck ROM tests such as CFRT and lateral flexion did not show predictive value, the findings highlight the clinical utility of incorporating cervical rotation screening into preseason evaluations.
Given the strong association between neck mobility deficits and injury risk, interventions targeting neck range of motion—such as manual therapy, mobility drills, or neuromuscular re-education—could be promising components of arm injury prevention programs. Future research is warranted to explore whether improving neck rotation asymmetries can effectively reduce injury incidence and to confirm these findings in larger, multi-team cohorts across varying competition levels.

⚾ Upside Study: Pitch Types and Their Influence on Elbow Varus Torque and Spin Rate in Professional Baseball Pitchers
Introduction
In professional baseball, the increasing emphasis on pitch velocity and spin rate has brought new challenges to pitcher health, particularly regarding elbow injuries. Ulnar collateral ligament (UCL) injuries remain prevalent, with approximately 25% of Major League Baseball (MLB) pitchers undergoing UCL reconstruction. While many assume that higher spin rates or advanced pitch characteristics correlate with greater elbow stress, the actual biomechanical contributors to injury risk are still debated.
This study aimed to dissect the biomechanical load placed on the elbow joint—specifically elbow varus torque, cumulative torque, and torque loading rate—across four common pitch types: fastball, curveball, change-up, and slider. Using 3D motion capture and radar-based ball tracking in 31 professional pitchers, the authors analyzed the relationship between pitch mechanics and elbow stress, as well as whether spin rate influences these loads.
Authors:
Alexander J. Hodakowski,* MD, Brittany Dowling,y MS , John T. Streepy,z MS, Bjorn Olmanson,§ MD, Logan Schmitt,|| MS, Marc J. Richard,* MD, Nikhil N. Verma,y{ MD, and Grant E. Garrigues,y{# MD Investigation performed at Rush University Medical Center, Chicago, Illinois, USA
Submitted September 5, 2024; accepted October 29, 2024.
Presented as a poster at the AOSSM annual meeting, Denver, Colorado, July 2024.
You can download the full PDF study by clicking on the button below:
Key Findings and Notable Statistics
⚾ 1. Fastballs Pose the Highest Elbow Stress
Ball Velocity: Fastballs had the highest average velocity at 40.4 ± 0.6 m/s (90.4 mph).
Peak Elbow Varus Torque: Fastballs generated the greatest average torque at 90.1 ± 3.5 N·m, significantly higher than:
Curveballs (87.5 ± 2.7 N·m)
Sliders (87.7 ± 2.7 N·m)
Change-ups (81.3 ± 2.4 N·m)
Cumulative Torque (total torque over time): Fastballs = 3015.0 ± 101.3 N·m·s (highest overall).
Torque Loading Rate: Fastballs also had the most rapid force onset at 780.7 ± 65.4 N·m/s.
🌀 2. Spin Rate Does Not Correlate with Elbow Torque
Curveballs had the highest spin rate: 2352 ± 70 rpm, yet not the highest torque.
Fastballs spin rate: 2153 ± 88 rpm.
Change-ups had the lowest spin rate: 1776 ± 145 rpm.
Despite these differences, no statistically significant correlation was found between spin rate and elbow varus torque for any pitch type.
Suggests spin rate alone is not a predictor of joint load or injury risk.
🧮 3. Change-ups Appear Safer—But Have Hidden Load
Lowest peak torque: 81.3 N·m
Lowest loading rate: 661.5 ± 50.9 N·m/s
However, change-ups had the second-highest cumulative torque: 2926.9 ± 96.2 N·m·s, due to the longer time under torque.
Implies sustained elbow stress, which could contribute to microtrauma over time.
🌀 4. Curveballs Show the Lowest Total Load
Cumulative Torque: Lowest among all pitch types at 2806.9 ± 93.6 N·m·s.
Moderate peak torque and loading rate, making it potentially less stressful overall.
Despite this, previous studies have found mixed results on the injury risks of curveballs in youth pitchers.
🔁 5. Sliders Represent a Middle Ground
Peak torque (87.7 N·m) and loading rate (738.0 N·m/s) were close to those of curveballs.
Cumulative torque was lower than fastballs and change-ups, but higher than curveballs.
Conclusion
This study adds critical nuance to the understanding of elbow stress in baseball pitching. While fastballs remain the cornerstone of modern pitching strategy due to their velocity and perceived dominance, they also impose the highest biomechanical stress on the elbow joint, as measured by peak torque, cumulative load, and torque loading rate. These metrics are all known contributors to overuse injuries, especially UCL damage.
Importantly, while spin rate is a common metric in evaluating pitch effectiveness, the data shows it does not correlate with elbow torque—contrary to popular belief in some coaching and scouting circles. Therefore, relying on spin rate as a proxy for injury risk may be misguided.
The introduction of cumulative torque and torque loading rate as biomechanical markers offers a more complete picture of elbow stress. These metrics, especially cumulative torque, may better capture the total strain on elbow structures over time, rather than relying solely on peak momentary forces.
Implications for Practitioners:
Pitch type matters more than spin rate when assessing elbow injury risk.
Monitoring cumulative torque and loading rate could inform better workload management and injury prevention strategies.
Fastballs may warrant more cautious usage, particularly during high-intensity workloads, despite their importance in game strategy.
Change-ups, while often considered a lower-risk pitch, may carry hidden cumulative stress due to longer time under torque.
Future Research Recommendations:
Expand cumulative torque metrics into long-term workload monitoring systems.
Investigate interventions that can lower loading rates (e.g., strength training, throwing mechanics modifications).
Assess these findings in younger or non-professional athletes for broader applicability.
You may also like:
📈 🏈 Upside Studies: Cardiac Arrest & Neurologic Recovery: Insights from the Case of Mr. Damar Hamlin

Title: Cardiac Arrest & Neurologic Recovery: Insights from the Case of Mr. Damar Hamlin
⭐Upside Studies: “Icing the shooter” in Basketball: The Unintended Consequences of Time-Out Management When the Game is On The Line

Title: “Icing the shooter” in basketball: The unintended consequences of time-out management when the game is on the line
