
Analysts behind some of the sport’s biggest names, including Serena Williams and Coco Gauff, on how AI is changing the way stars compete, train and prevent injury
The likes of Williams and Gauff are using innovations such as in-match iPad analysis and the reading of daily blood samples to gain an extra edge

Tom Kershaw, Tennis Correspondent
Thursday June 25 2026, 8.00pm BST, The Times
Then Serena Williams decided to make her comeback this year, the first call her head coach, Jarmere Jenkins, made was to Mike James, a performance analyst from Leicester.
“He wanted a ‘Serena playbook’,” James says. “He wanted all of her key winning patterns when she was at her best, what she was doing well on the deuce side and ad side on serve and return, during the point, which type of serve, which type of spin, should she hit more forehands, and we dived into all the historical data to give him something for her training programme in Florida.”
The obsession with fine margins has never been greater at the vanguard of tennis’s data revolution. Aryna Sabalenka, the world No1, wins about 55 per cent of the points she plays, whereas the world No50 will win about 49 per cent. That 6 per cent gap is the difference between winning multiple grand-slams and going an entire career without winning a WTA title.
In days of old, players typically travelled with only a coach. Now their boxes look like a Premier League bench. A data analyst with an iPad tracks every single movement and feeds live information to the coach during matches, who can then decide whether to alter the strategy.
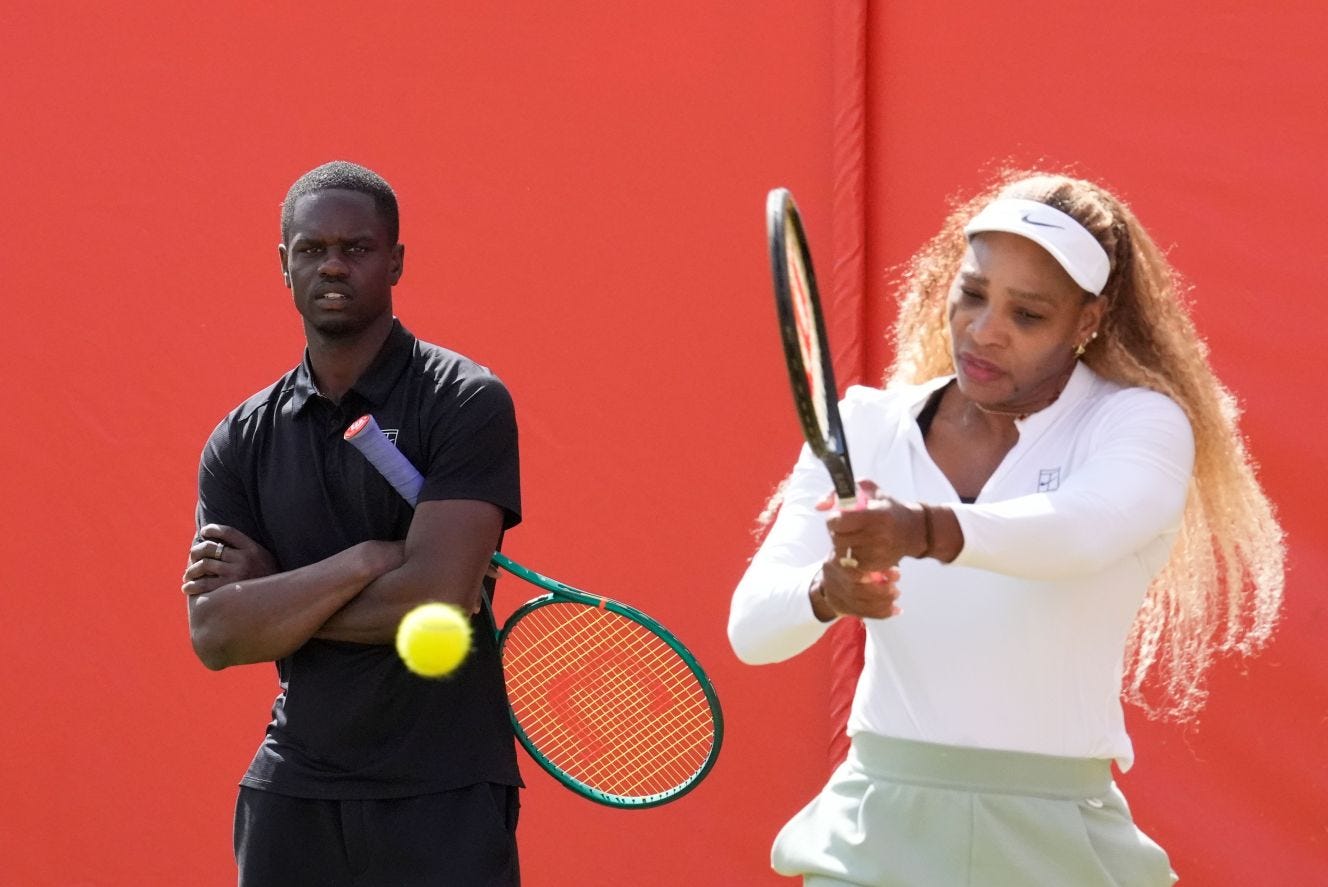
When Williams decided to make a comeback, Jenkins, left, looked at data showing her key winning patterns from her peak years. (CREDIT: OWEN HAMMOND/NURPHOTO/SHUTTERSTOCK)
In the 2023 Australian Open final, Sabalenka’s analyst, Shane Liyanage, advised that she hit harder and deeper into a particular area of the court after losing the first set against Elena Rybakina. Liyanage doesn’t want to give away the specifics, given the pair head into Wimbledon as the first and second seeds, but it was pivotal to the result. “It was only a fraction, a couple of points probably went our way with that change, but it just swung the momentum,” he says.
James and Liyanage both work for Orreco, which has taken the use of artificial intelligence in tennis to new extremes. Along with Williams and Sabalenka, Coco Gauff, Marta Kostyuk and the two breakout Spanish stars of this season, Rafael Jodar and Martín Landaluce, are among a dozen or so top-level professionals that work with individual analysts.
“I don’t want to sound like Donald Trump, but this has never been done before in tennis,” James, who is more entertaining than a stereotypical data whizz, says before doubling over in laughter. “What we’re doing is an MRI scan of a player’s game and covering them from a 360-degree health management point of view, using biomarkers through to biomechanics and in the middle is match analytics.”
The analytics go into incredibly fine detail, harvesting databases to track the ball speeds, spin rates, shot selection tendencies and patterns of movement of every player on tour in virtually every scenario during a point. That allows the AI to then build sophisticated simulations of a match between a client and any opponent so they can adjust their strategy accordingly to suit their strengths, expose the opponent’s weaknesses and subtly shift the odds.
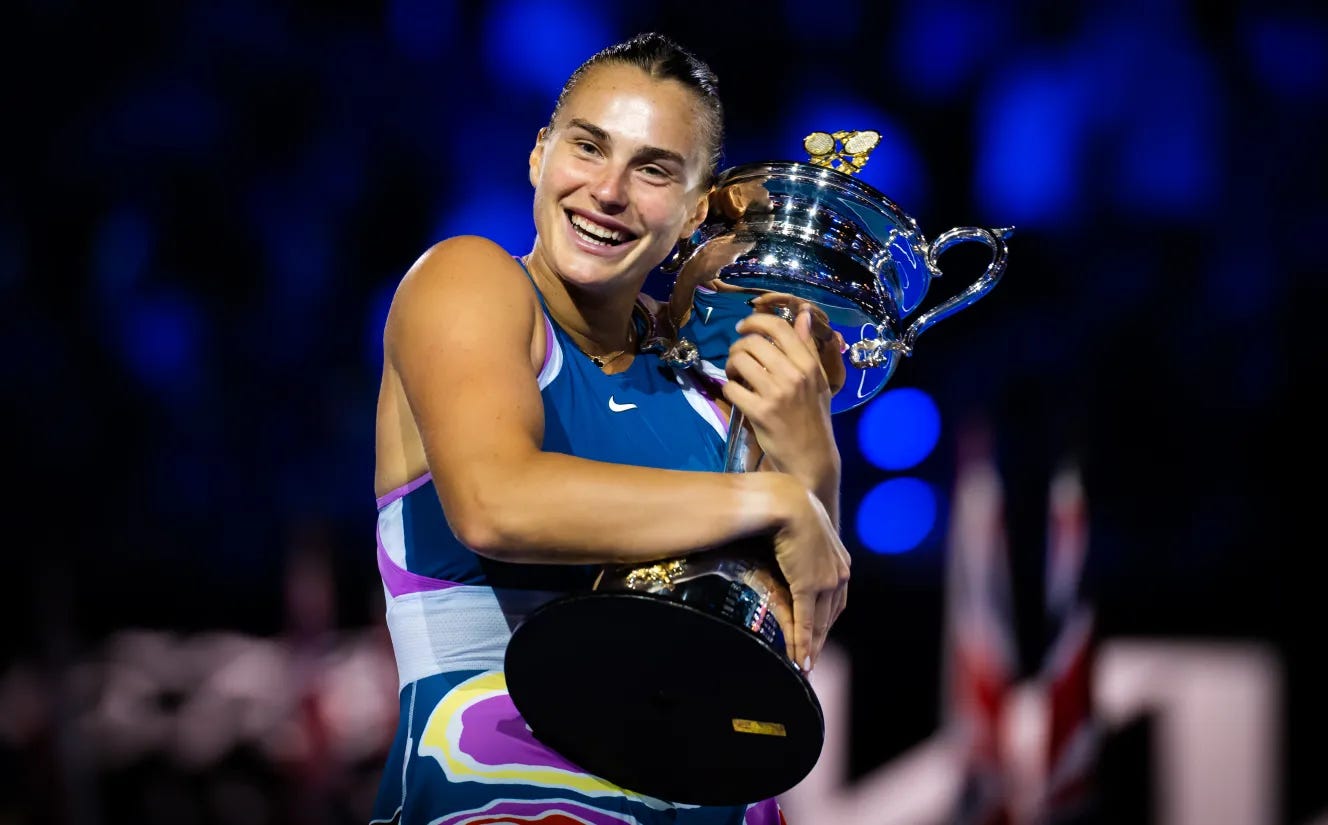
Sabalenka came from a set down to win the 2023 Australian Open final after her analyst advised a change of tactics (CREDIT: ROBERT PRANGE/GETTY IMAGES)
The best players tend to be able to make those adaptations more seamlessly. “A player ranked No150 in the world might not have a B, C and D game. But the top players have a Swiss army knife of abilities to change things, which I think then allows them to be more receptive to us,” James says.
What’s most fascinating though are the advancements being made off the court, largely to prevent injuries. All manner of factors — players’ increased athleticism, slower court speeds, heavier balls, longer rallies, more night sessions, extended mandatory events — have resulted in more top players spending lengthy spells on the sidelines than ever before. To combat that, James and Liyanage ask players to give a daily blood sample so their biomarkers can be tracked and used to measure stress and inflammation.
A combination of GPS and sleep data from wearable technology is also fed back, so the analysts can detect unusual changes and manage the load on the body. The skeletal tracking can also detect how much strain a player has put on a particular joint during a match, such as if they slid more on a particular side on grass and how often a serve or groundstroke strayed outside the player’s typical range of motion.
The information builds up to a point where any part of the body can be flagged if it enters the red zone. “Ninety-five per cent of people in tennis will say they want to improve their forehand. They want to make it faster. What we’re looking at is how to make it faster but also robust, so you’re not going to break down and get injured because of that technical change,” Liyanage says.
Female players are now also increasingly adjusting their games depending on their menstrual cycle experiences. The topic has often been a taboo as the WTA Tour is dominated by male coaches, but accumulating data shows potential differences in performance that were being overlooked. “We’ve looked at a number of players and shot execution can be off depending on factors affected by menstrual cycle-related hormone fluctuations, such as neuromuscular control, force production, kinetic chain biomechanics, and spatial processing” Liyanage says.
“The other interesting bit is around the middle of the cycle we’re seeing athletes seemingly able to generate more speed, but they have more errors because they can’t control the ball as much. Maybe this is partly a speed-accuracy phenomenon, we’re only scratching the surface here.”
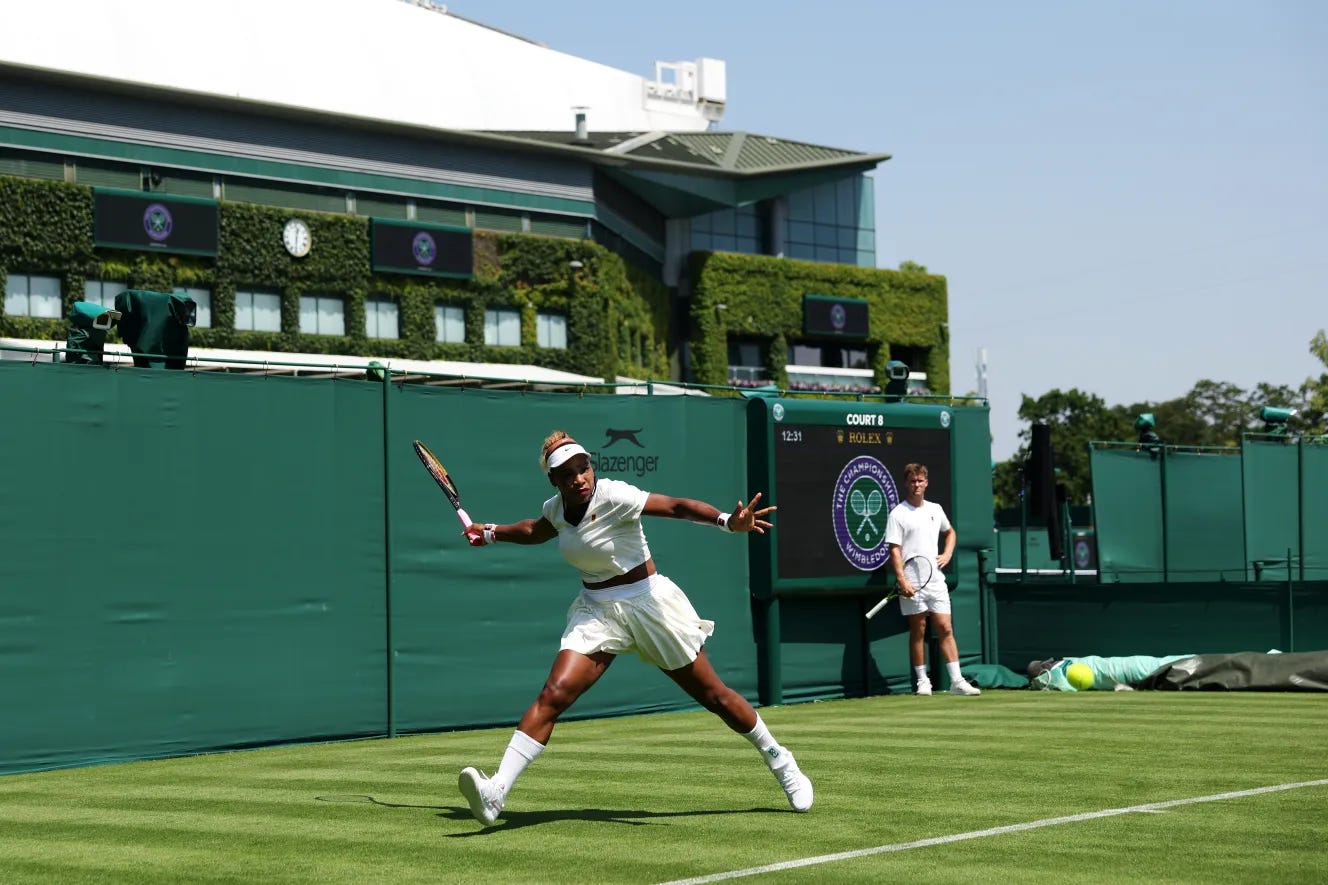
Data has shown clear differences in performance metrics depending on how a female player experiences her menstrual cycle and related symptoms (CREDIT: CLIVE BRUNSKILL / GETTY IMAGES)
James and Liyanage envisage a world where eventually the players could even analyse their own data during matches.
“At the United Cup, they actually have a set-up where players can go to the bench and the coach is there with his iPad,” Liyanage says. “One of the players we were working with disagreed with their coach so they got the iPad and looked at it themselves.”
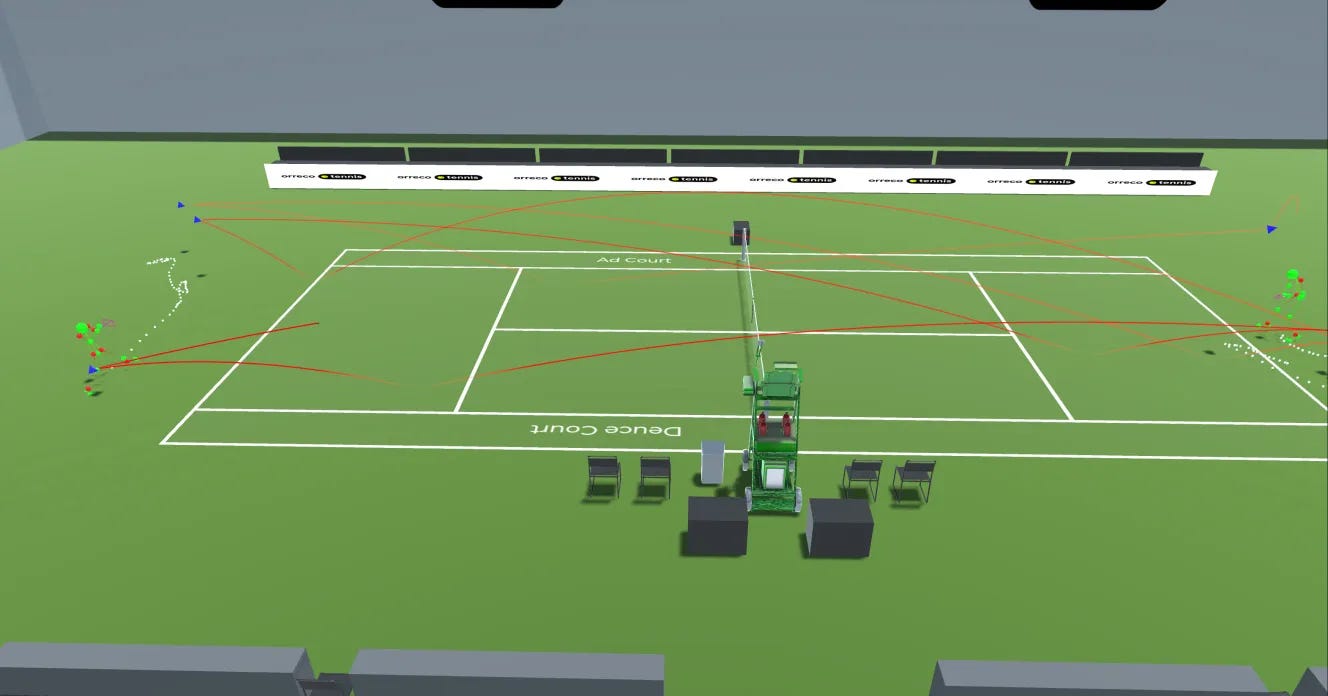
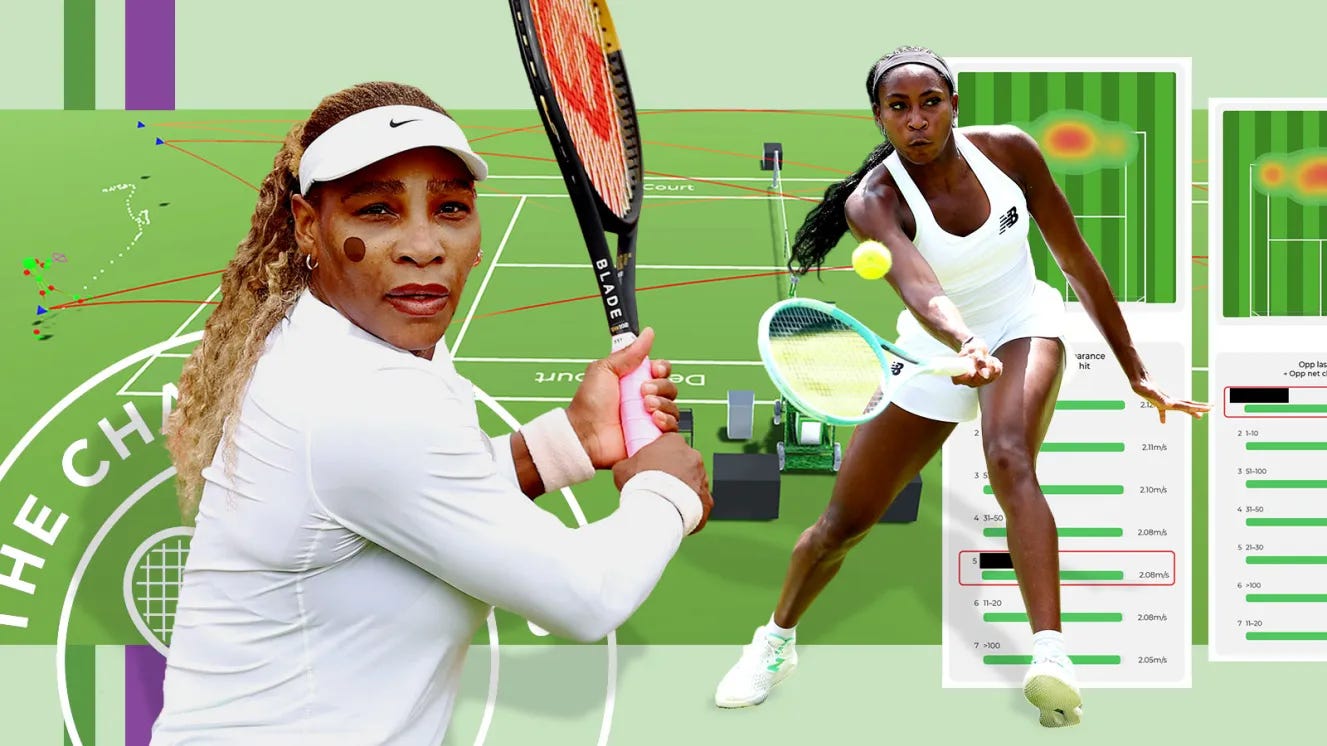
An example of the technology used by the players (CREDIT: ORRECO)
James adds: “The generation of players coming through challenges their coaches a lot more. It’s not like the 1990s or 2000s when you’d stick with the same coach for four or five years. There’s more chopping and changing, so you have to go in and say, ‘Here is the evidence that the changes we’ve made are backed up by data and trending in the right direction.’
“We’re still behind football, NBA, big team sports, but tennis has gone from a player-dominated sport where it’s ex-players coaching and sort of, ‘We did it this way 30 years ago,’ to becoming a lot more innovative.”
It is worth pointing out that three of the four Wimbledon women’s semifinalists use Orreco Tennis platform including Player Dex and Trax.