
⚽ Upside Soccer Study (1): The Evolution of Match-Play in Major League Soccer (2018–2023)
Published in the International Journal of Sports Science & Coaching (2026) by Callum J. McCaskie and Christopher Wing.
Study: The Evolution of Match-Play in Major League Soccer from 2018 to 2023
Authors: Callum J. McCaskie and Christopher Wing
Institution: Edith Cowan University, Nutrition and Health Innovation Research Institute, Australia.
To download the Full study click on the below button:
🧩 Introduction
How has Major League Soccer evolved over the past six seasons, and what separates successful MLS teams from those that fail to qualify for the playoffs?
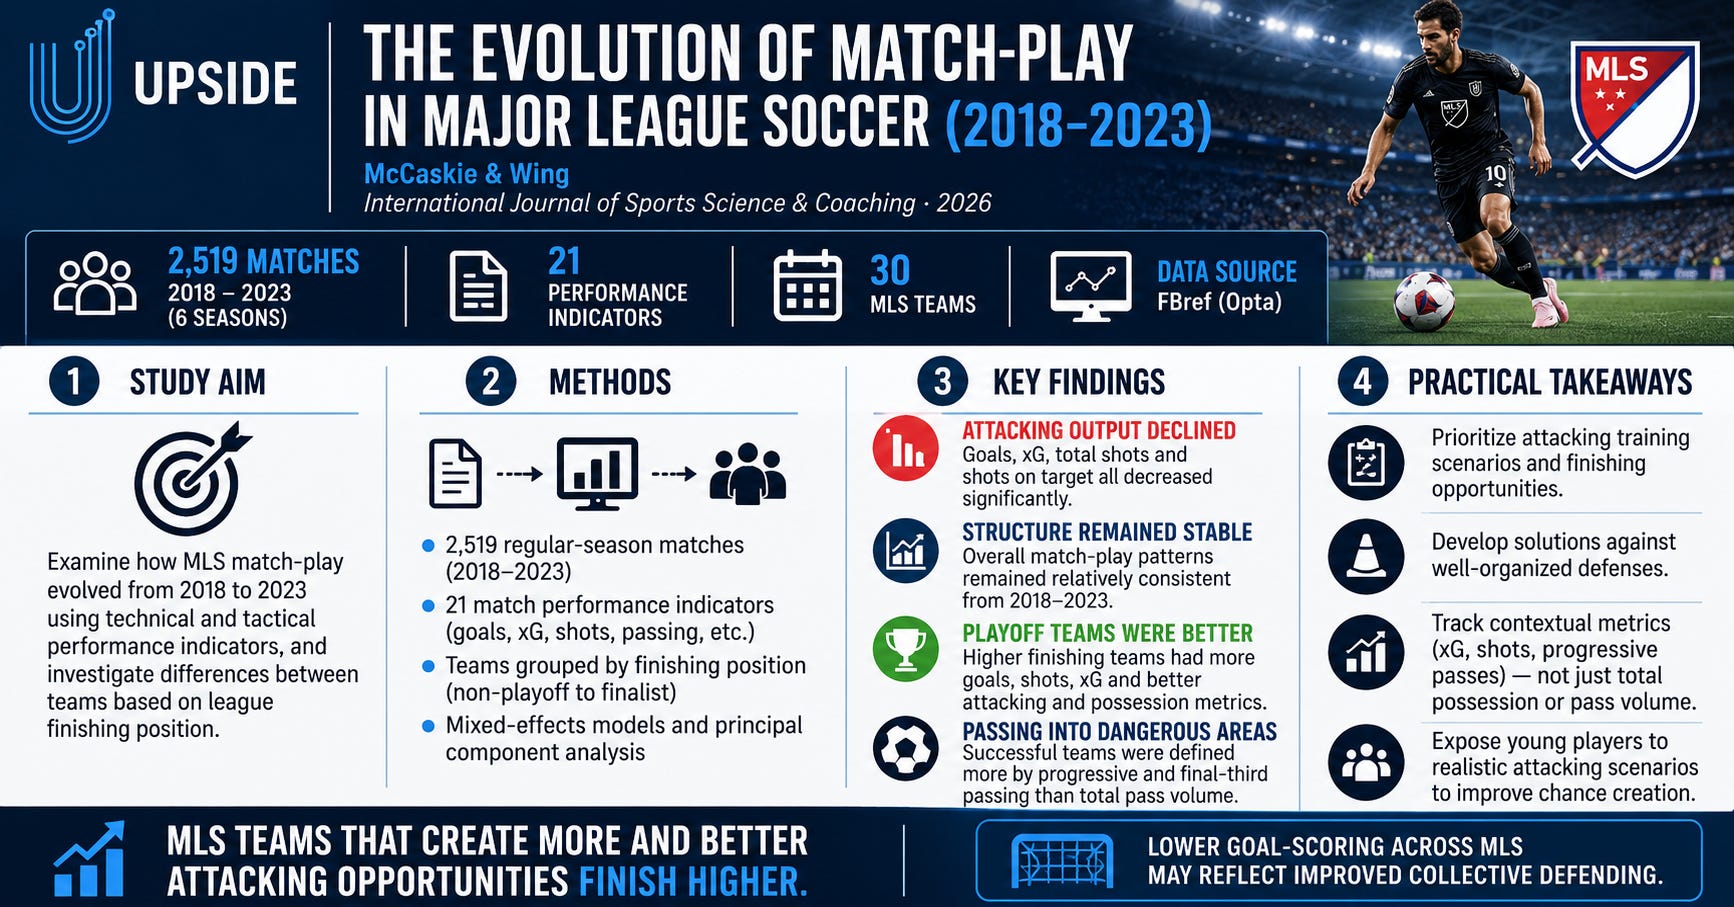
This study examined 2,519 MLS regular-season matches from 2018 to 2023, analyzing 21 technical and tactical performance indicators to understand changes in playing style, attacking effectiveness, passing behavior, and team success.
Despite the league’s rapid expansion and growing investment in coaching, analytics, and player development, the researchers found that MLS match-play remained relatively stable in its overall structure.
However, several important attacking indicators declined significantly, including goals, expected goals (xG), total shots, and shots on target.
One of the most important findings was that successful MLS teams consistently demonstrated superior attacking output and better ability to move the ball into dangerous areas, rather than simply accumulating more passes.
🧪 Study Overview
Design: Retrospective observational analysis of MLS match performance.
Seasons analyzed: 2018–2023 (six seasons).

Data source: FBref, using Opta match-performance data.
Matches by season:
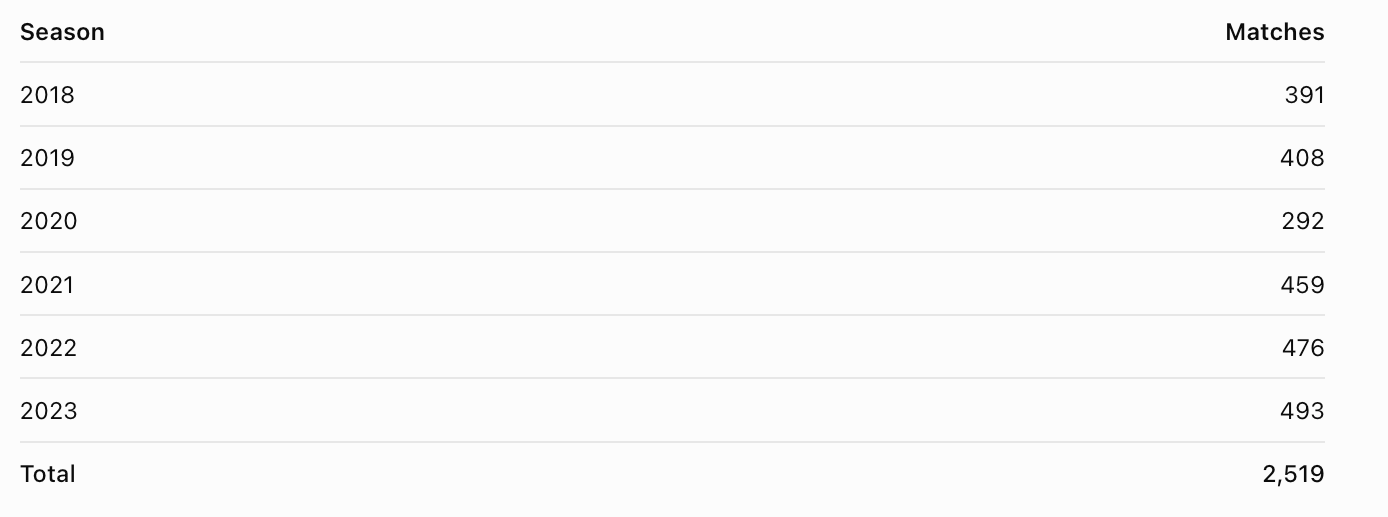
The 2020 season was disrupted by COVID-19, resulting in fewer matches.
The researchers evaluated performance indicators including goals, xG, shots, passing volume and accuracy, progressive passing, carries into attacking areas, crosses, and tackles.
Teams were also grouped by their final playoff achievement: did not qualify, first round, quarterfinals, semifinals/conference finals, and finalists.
Statistical methods included principal component analysis (PCA), mixed-effects modeling, and sensitivity analyses.
📊 Key Findings
⚽ 1. MLS Match-Play Remained Structurally Stable
Despite the growth of the league, the researchers did not identify a major structural transformation in match-play characteristics between 2018 and 2023.
The first two principal components explained 62.1% of the variance in performance indicators:
44.1% was associated primarily with attacking and possession characteristics.
18.0% was associated with goal scoring and penalty-area actions.
There was substantial overlap between seasons, suggesting that the underlying technical and tactical structure of MLS remained relatively stable.
This does not mean individual teams did not change their playing styles. Rather, the league-wide statistical patterns did not show a distinct structural shift.
📉 2. Attacking Output Declined Significantly
One of the most striking findings was the decline in several attacking performance indicators.

All four indicators showed statistically significant negative trends across the study period.
The researchers suggested that improved collective defending, greater tactical organization, and more sophisticated opposition analysis could be contributing factors.
However, defensive organization was not measured in sufficient detail to establish this explanation.
Implication: MLS teams may need to dedicate more attention to creating high-quality scoring opportunities against increasingly organized defensive structures.
🎯 3. Successful MLS Teams Generated More Goals, Shots and xG
The study identified clear differences between teams that qualified for the playoffs and those that did not.
All playoff groups scored significantly more goals and registered more shots on target than non-qualifying teams.
Teams reaching the later playoff rounds also generally demonstrated stronger expected-goals performance.
Notable comparisons included:
Goals: Finalists versus non-qualifiers showed a large effect size (Cohen’s d = 2.00 in magnitude).
Shots on target: Semifinalists versus non-qualifiers showed a large effect (d = 1.38 in magnitude).
xG: Finalists versus non-qualifiers showed a large effect (d = 1.50 in magnitude).
These results reinforce the importance of both the quantity and quality of attacking opportunities.
The findings are associations with season success, not proof that increasing one statistic independently will produce a higher league finish.
🥅 4. Passing Into Dangerous Areas Was More Important Than General Passing Volume
Another important finding concerned passing performance.
The researchers found that successful teams were differentiated more clearly by where they moved the ball than by overall passing volume.
Quarterfinalists and semifinalists generally demonstrated higher levels of:
Passes into the final third.
Passes into the penalty area.
Progressive passing distance.
Short passes attempted and completed.
Meanwhile, total passing volume and medium- and long-pass counts did not consistently differentiate finishing positions.
This suggests that counting passes alone provides limited insight into attacking effectiveness.
For performance analysts, the location, progression, and attacking purpose of passes may be more informative than simple passing totals.
📉 5. Long Passing and Progressive Ball Movement Declined
Several ball-movement indicators also declined significantly across the six seasons.
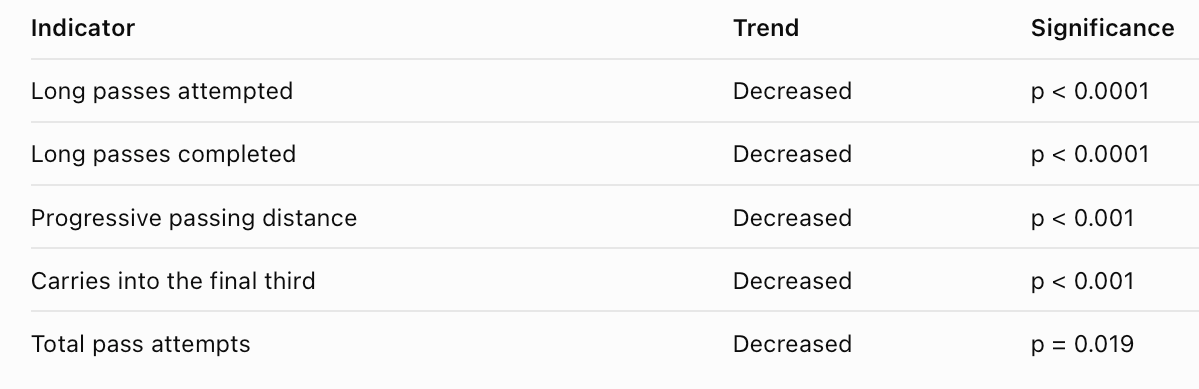
The reduction in long passing may indicate a movement away from some direct playing styles.
However, the researchers did not find the broad increase in possession-based passing observed in certain European leagues.
This raises an interesting possibility: MLS may be developing along a different tactical trajectory rather than simply following European soccer trends.
🛡️ 6. Better Defensive Organization Could Be Contributing to Lower Scoring
The researchers proposed that improvements in collective defending could help explain the reduction in attacking output.
Possible contributing factors include more organized defensive structures, improved opponent analysis, and greater tactical preparation.
However, the study measured only one defensive indicator directly: total tackles.
Consequently, it cannot establish whether pressing effectiveness, defensive compactness, or other defensive improvements caused the decline in attacking metrics.
This is an important area for future research.
🧠 Implications for MLS Teams and Practitioners
The study has several implications for coaching, player development, performance analysis, and sports science departments.
For coaching staff, the findings highlight the importance of training attacking patterns that create high-quality scoring opportunities. This could include combination play, movement into the penalty area, and decision-making against compact defensive structures.
For performance analysts, the research supports using contextual attacking indicators rather than relying on passing volume or possession statistics alone.
For academy directors, the findings suggest exposing young players to realistic attacking scenarios, including breaking down organized defenses and progressing the ball into dangerous areas.
For sports performance departments, the findings provide a tactical context for designing training sessions. However, the study did not measure GPS loads, sprint demands, accelerations, or other physical performance variables, so it cannot establish how MLS physical demands changed.
📌 Recommendations
For MLS Coaches and Technical Staff
Prioritize training scenarios that improve chance creation and finishing.
Develop attacking solutions against organized defensive blocks.
Train players to progress the ball effectively into the final third and penalty area.
Incorporate realistic match scenarios that challenge attacking decision-making.
Evaluate attacking effectiveness through xG, shots on target, and contextual passing metrics.
For Sports Performance and Strength & Conditioning Staff
Collaborate with technical coaches to design physically realistic attacking drills.
Integrate accelerations, decelerations, changes of direction, and repeated movements into attacking scenarios where appropriate.
Use GPS and movement tracking to measure the physical demands of these exercises.
Evaluate whether training exposure reflects the demands of the team’s tactical approach.
These are practical extensions of the research, not physical-training interventions directly tested in the study.
For Performance Analysts
Monitor xG, goals, shots on target, and passes into dangerous areas.
Evaluate progressive passing and ball carries within tactical context.
Compare attacking metrics across opponents and match situations.
Avoid relying exclusively on total passes or possession percentages.
Investigate how attacking efficiency changes against different defensive systems.
For Academy and Player Development Staff
Prepare young players for congested defensive environments.
Develop decision-making in the final third.
Emphasize progressive passing, combination play, and movement into space.
Train players to recognize and exploit scoring opportunities.
Align development objectives with the technical and tactical demands observed at the professional level.
⚠️ Limitations
The authors identified several important limitations:
1. Limited defensive data: Total tackles was the only defensive indicator analyzed. Pressing, defensive compactness, and other tactical behaviors were not captured.
2. Six-season observation period: The study covered 2018–2023, limiting conclusions about longer-term league evolution.
3. COVID-19 disruption: The 2020 season included fewer matches and unusual competitive conditions. Sensitivity analyses excluding that season generally supported the principal findings.
4. Aggregated season-level data: The researchers used team averages rather than detailed match-by-match tactical analysis.
5. Missing contextual factors: Weather, home versus away conditions, match timing, and other situational variables were not included.
6. Small finishing-position groups: Finalists and other advanced playoff groups had relatively small samples, limiting the precision of some comparisons.
7. No physical performance measurements: The study did not evaluate running distances, sprinting, high-speed running, or acceleration demands.
Future research should incorporate physical tracking data, detailed defensive indicators, and comparisons with other professional soccer leagues.
✅ Conclusion
This study provides important insights into how MLS match-play evolved between 2018 and 2023.
Despite substantial league growth, the underlying technical and tactical structure of MLS remained relatively stable.
At the same time, goals, expected goals, total shots, and shots on target declined significantly.
The strongest differences between successful and unsuccessful teams were found in attacking output, shot creation, and the ability to progress the ball into dangerous areas.
For MLS coaches and practitioners, the findings reinforce the value of designing training programs that improve attacking effectiveness, rather than focusing exclusively on possession or passing volume.
For performance analysts, the study highlights the importance of contextualizing technical and tactical data to identify the indicators most relevant to competitive success.
The central takeaway is simple:
In MLS, success is not just about how much a team passes or possesses the ball. It is about how effectively that team creates and converts dangerous attacking opportunities.
⚽ Upside EPL Study (2): Are Optical Tracking Technologies Overestimating Sprint Running Demands in the Premier League?
Published in Science and Medicine in Football (2023), Volume 7, Issue 4, pp. 374–383.
Study: Interchangeability of Optical Tracking Technologies: Potential Overestimation of the Sprint Running Load Demands in the English Premier League
Authors: Matt Taberner, Tom Allen, Jason O’Keefe, Chris Richter, Daniel Cohen, Damian Harper and Martin Buchheit.
Organizations represented: Liverpool John Moores University, Arsenal FC, University of Central Lancashire, Everton FC, Kaia Health, University of Santander, Colombian Ministry of Sport, Kitman Labs and Lille OSC.
Click on the button below to download the Full study.
🧩 Introduction
Professional soccer teams increasingly rely on optical tracking technologies to monitor player running loads, quantify match demands, design training programs, and guide return-to-play decisions.
But what happens when two tracking technologies produce significantly different results for the same player during the same match?
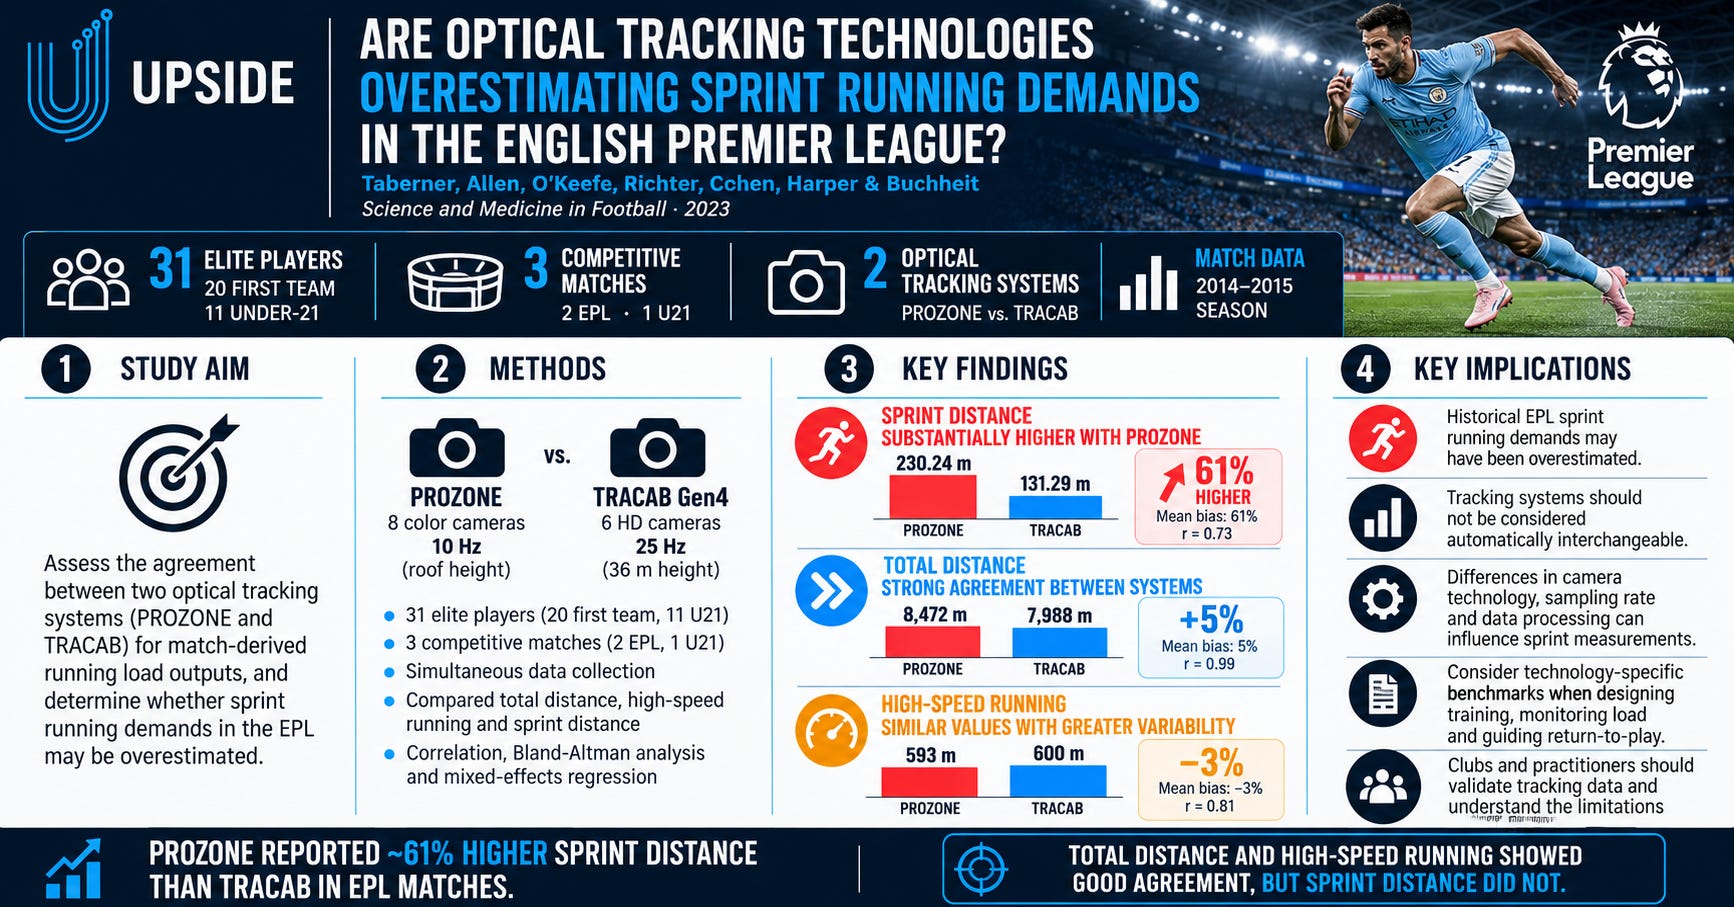
This study investigated the interchangeability of two optical tracking systems historically used in the English Premier League: PROZONE and TRACAB.
The researchers compared total distance, high-speed running, and sprint distance recorded simultaneously by both systems during competitive matches.
The findings revealed a significant concern:
PROZONE reported substantially greater sprint distances than TRACAB, with an average reported bias of 61%.
This discrepancy raises important questions about the accuracy of historical EPL running-load data, the interpretation of player performance, and the validity of forecasts suggesting that sprint demands are increasing dramatically.
For sports scientists, strength and conditioning coaches, rehabilitation specialists, and technology providers, the study highlights why tracking systems should not automatically be considered interchangeable.
🧪 Study Overview
Design: Observational technology-comparison study using simultaneous optical tracking during competitive soccer matches.
Data collection: 2014–2015 EPL season.

Participants:
20 EPL first-team players (average age 27.0 ± 5.1 years).
11 under-21 players (average age 17.5 ± 1.3 years).
Matches analyzed:

Technologies Compared

Both systems recorded the same matches, and their final post-processed tracking outputs were compared.
Running Metrics Examined

The researchers used correlation analysis, Bland–Altman agreement analysis, mixed-effects regression, and calibration equations to evaluate differences between the technologies.
📊 Key Findings
1. Sprint Distance Was Substantially Overestimated by PROZONE
The most important finding concerned sprint distance.
Despite a strong positive correlation between the two systems, PROZONE consistently reported substantially higher sprint volumes.
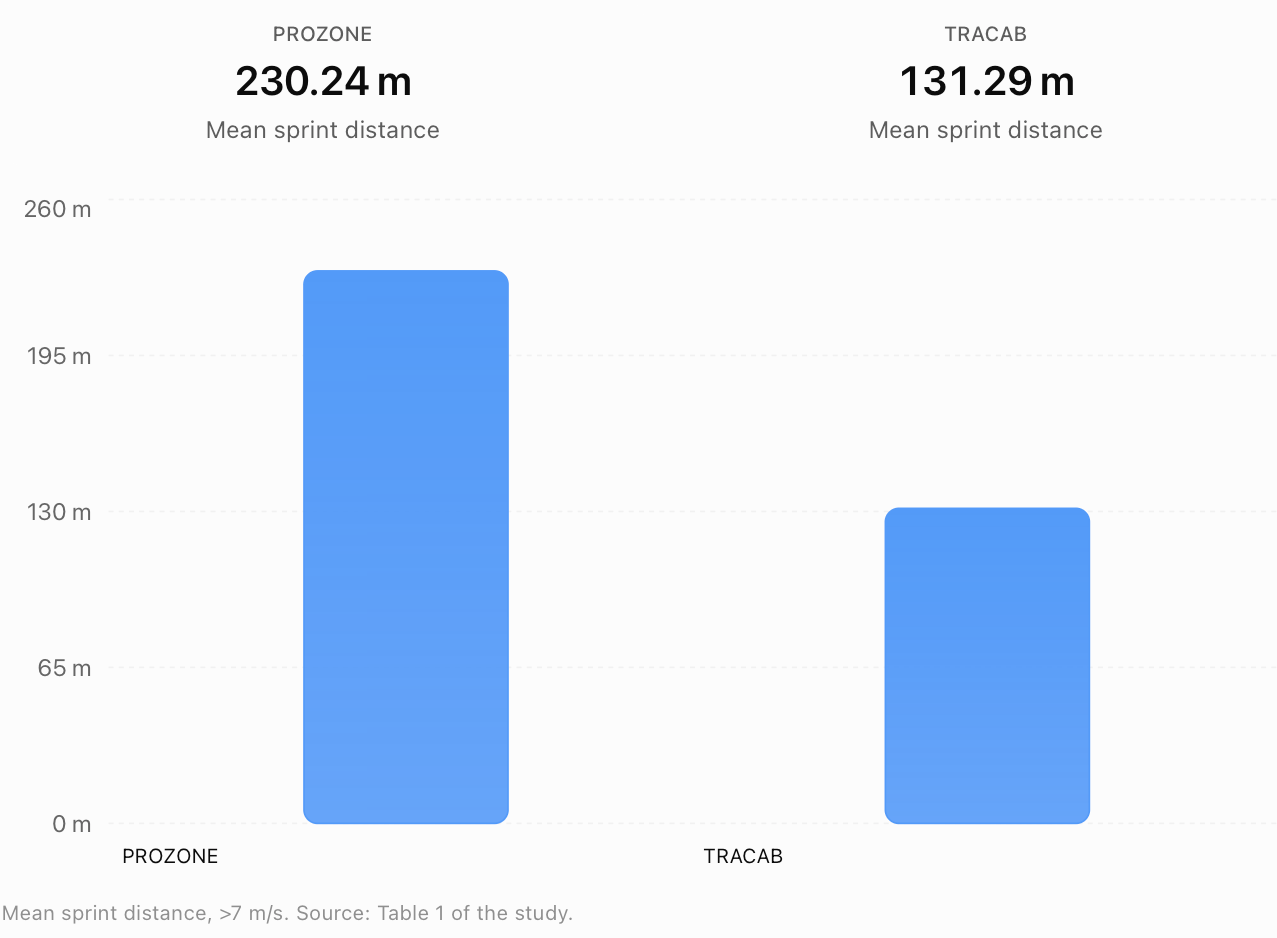
The reported results included:
Mean bias: 61%.
Correlation: r = 0.73.
Standard error of estimate: 34%.
Effect size: Cohen’s d = 0.76.
Although both systems identified similar relative patterns between players, they produced substantially different absolute sprint-distance measurements.
The mean raw difference was approximately 99 meters per observation.
This is particularly relevant because sprint exposure is commonly used to guide high-speed training, hamstring rehabilitation, and return-to-sport progression.
2. Total Distance Showed Excellent Agreement Between Systems
In contrast to sprint distance, total distance measurements were closely aligned.

The authors concluded that total-distance data could be interpreted across the two systems with relatively limited concern.
Although the systems produced an average difference of approximately 484 meters, the researchers considered the magnitude unlikely to meaningfully alter training decisions in most professional soccer contexts.
Practical implication: Total distance appears considerably more robust to differences between these particular optical tracking technologies than sprint distance.
3. High-Speed Running Showed Reasonable Agreement, but With Greater Variability
High-speed running measurements were also relatively similar between the two systems.
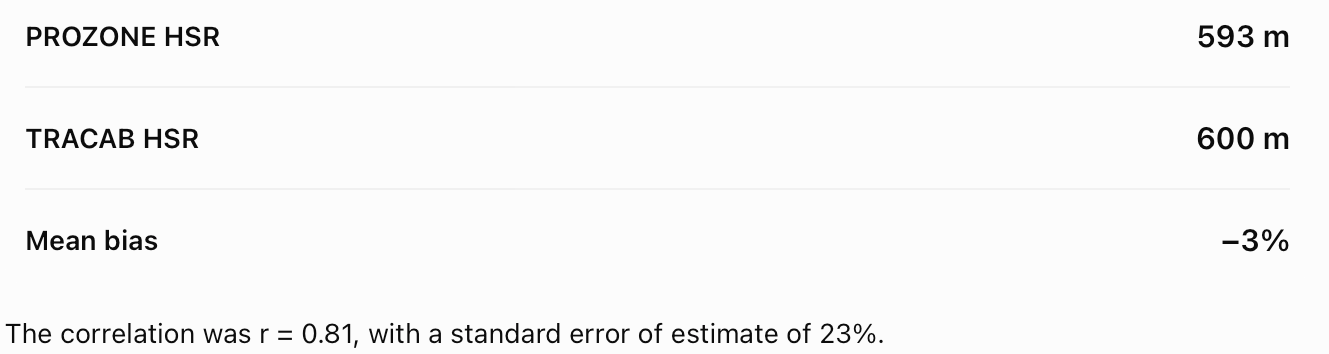
The researchers considered the overall mean bias relatively small, but highlighted meaningful variability between matches and individual observations.
This distinction is important: two technologies can produce similar group averages while still generating considerable uncertainty for individual players.
4. Stadium Design and Camera Positioning May Influence Tracking Accuracy
The researchers observed substantial differences in sprint-distance bias across stadiums.
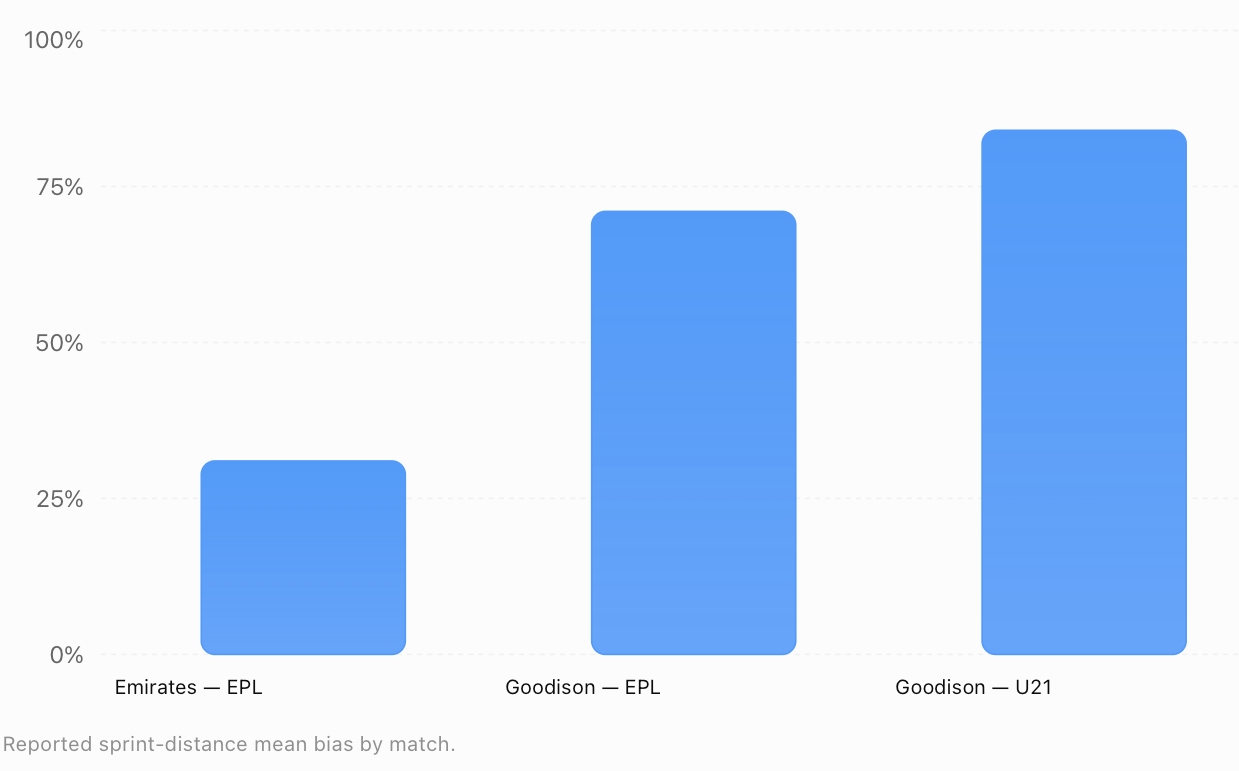
The sprint-distance bias increased from 31% at Emirates Stadium to 71% and 84% during matches at Goodison Park.
The authors suggested that differences in camera positioning, stadium geometry, resolution, and tracking configuration may have contributed.
Emirates Stadium features a relatively consistent open-bowl design, whereas Goodison Park had a more traditional four-stand configuration with varying heights and camera angles.
These findings suggest that stadium characteristics may influence optical tracking outputs, although the study could not isolate stadium design as the cause.
5. Camera Sampling Frequency and Data Processing May Explain the Differences
The two systems used different camera technologies.
PROZONE recorded positional data at 10 Hz, compared with 25 Hz for TRACAB.
That corresponds to one positional measurement every 100 milliseconds for PROZONE versus every 40 milliseconds for TRACAB.
The researchers identified several potential sources of disagreement:
Camera sampling frequency.
Image resolution.
Camera positioning and distribution.
Positional-data smoothing and filtering.
Proprietary algorithms used to calculate velocity and distance.
Sprint measurements may be particularly sensitive to these differences because small errors in instantaneous speed can change whether a movement exceeds the sprint threshold.
The study reinforces that the accuracy of a tracking system depends not only on its cameras, but also on the algorithms used to transform positional data into performance metrics.
6. Historical EPL Sprinting Demands May Have Been Overestimated
An important implication of the research concerns how the physical demands of professional soccer have evolved.
Earlier EPL research reported approximately a 35% increase in sprint distance between the 2006/07 and 2012/13 seasons.
These findings have contributed to the perception that modern soccer is becoming progressively faster and more physically demanding.
However, the current study suggests that historical PROZONE data may have overestimated the absolute amount of sprint running performed by players.
Importantly, the authors did not dispute the historical upward trend itself. Instead, they questioned the absolute sprint-distance values and the magnitude of forecasts based on them.
The study’s Figure 5 illustrates how applying calibration equations reduces the estimated sprint distances while preserving the general upward trajectory.
Implication: Before concluding that modern players must prepare for dramatically greater sprint volumes, clubs should consider whether historical and contemporary tracking data are directly comparable.
7. Tracking Differences Can Significantly Affect Individual Player Monitoring
The researchers illustrated how these measurement differences could affect an individual EPL full-back.
For one player, the study identified an approximately 126-meter difference in sprint distance after applying the calibration equation.
That difference represented roughly 40% of the player’s reported match sprint load.
Another example from Figure 6 compared the player’s season-long sprint-distance measurements:

These differences could change how practitioners interpret whether a player has received sufficient sprint exposure during matches.
They could also affect decisions about supplementary sprint training, weekly conditioning, and rehabilitation progression.
🧠 Implications for EPL Teams and Practitioners
For Heads of Sports Performance
The study highlights the importance of understanding the measurement limitations of tracking technologies before integrating their outputs into performance-management systems.
Clubs may use optical tracking for matches and GPS or local positioning systems during training. When these technologies produce different measurements, comparisons of match and training loads may be misleading.
A player could appear to have completed more sprint running during competition than the underlying physical demands justify.
This could influence weekly training plans and the interpretation of cumulative workloads.
For Strength & Conditioning Coaches
Sprint-distance data are frequently used to guide the amount of high-speed exposure players receive throughout the training week.
If match sprint distance is overestimated, practitioners could incorrectly conclude that a player has received sufficient sprint exposure.
The authors discuss how these discrepancies could influence decisions about additional positional speed or speed-endurance training.
For Rehabilitation and Return-to-Play Specialists
The implications may be particularly important during hamstring rehabilitation.
Sprint running places substantial mechanical demands on the posterior chain, and progressive sprint exposure is an important component of return-to-sport preparation.
If the reference match demands are inaccurate, rehabilitation staff may set sprint-distance targets that do not accurately reflect competition.
This could result in unnecessary additional running or inappropriate progression targets.
For Performance Analysts and Data Scientists
The findings emphasize the importance of validating data compatibility before combining information from different providers.
A historical database containing multiple tracking technologies should not automatically be treated as a single continuous dataset.
Even when two systems correlate strongly, meaningful differences in absolute measurements may remain.
📌 Recommendations
For Sports Performance Departments
Validate agreement between tracking systems before comparing their outputs.
Establish consistent definitions for total distance, HSR, and sprint distance.
Record the technology, software version, and processing methods associated with each dataset.
Review historical sprint-distance benchmarks before using them to prescribe training.
Consider individual player speed profiles alongside fixed speed thresholds.
For Strength & Conditioning Coaches
Avoid relying exclusively on optical sprint-distance measurements when prescribing running loads.
Combine match tracking data with training observations and other validated monitoring tools.
Consider the uncertainty associated with sprint measurements when planning supplementary speed sessions.
Evaluate sprint exposure within the context of playing position, tactical role, and match demands.
For Medical and Rehabilitation Staff
Confirm the reliability of match-derived sprint benchmarks before using them as return-to-sport targets.
Monitor rehabilitation sprint exposure using consistent measurement technologies where possible.
Avoid assuming that sprint volumes from different systems are directly interchangeable.
Integrate tracking data with physical assessments, movement quality, symptoms, and functional progression.
For Sports Technology Companies
This research also has important implications for companies developing optical tracking, GPS, local positioning, and athlete management technologies.
Potential priorities include:
Cross-platform validation: Demonstrate agreement with other commonly used tracking systems.
Transparent processing: Explain how raw positional data are filtered and transformed into running metrics.
Calibration: Develop validated methods for comparing historical and contemporary datasets.
Data integration: Help teams identify when measurements from different technologies should not be directly combined.
Uncertainty reporting: Communicate expected measurement error rather than presenting every output as equally precise.
For athlete management system providers, this creates an opportunity to help practitioners distinguish real changes in athlete performance from changes caused by measurement technology.
These are proposed applications of the findings, rather than products or solutions directly evaluated by the researchers.
⚠️ Limitations
The study has several important limitations.
1. Small sample: Only 31 players from one EPL club were included.
2. Limited number of matches: The comparison covered three competitive matches, restricting generalizability across clubs and stadiums.
3. Historical technology: The data were collected during the 2014/15 season using older generations of PROZONE and TRACAB.
4. Limited stadium representation: Only two stadiums were evaluated, making it difficult to isolate the influence of stadium architecture.
5. No simultaneous independent reference standard: The study compared two optical systems rather than directly validating both against a separate ground-truth measurement system.
6. No acceleration or deceleration analysis: These important performance variables were excluded because their calculation methods were not sufficiently known.
7. Uncertainty in calibration: The sprint-distance correction equations had substantial estimation error, meaning corrected values should not be considered exact.
8. Limited applicability to newer technologies: The results cannot automatically be generalized to contemporary tracking systems or newer software generations.
The authors specifically characterized their findings as preliminary and called for further research using larger samples and additional matches.
✅ Conclusion
This study raises important questions about the accuracy and interchangeability of optical tracking technologies used in professional soccer.
While PROZONE and TRACAB demonstrated strong agreement for total distance and reasonable agreement for high-speed running, their sprint-distance outputs differed substantially.
PROZONE reported higher sprint volumes than TRACAB, with an average reported bias of 61%.
These differences may have important implications for how clubs interpret historical match demands, design training programs, monitor sprint exposure, and guide rehabilitation.
The findings also challenge the assumption that historical and contemporary datasets can always be compared directly to establish how the physical demands of professional soccer are evolving.
However, the study does not establish that modern soccer is becoming less demanding or that historical increases in sprinting did not occur.
Instead, it demonstrates the importance of understanding measurement uncertainty before drawing conclusions from tracking data.
For professional teams and sports technology companies, the central takeaway is clear:
Collecting more athlete data is not enough. Teams must also understand how that data is measured, how accurate it is, and whether it can be meaningfully compared across technologies.
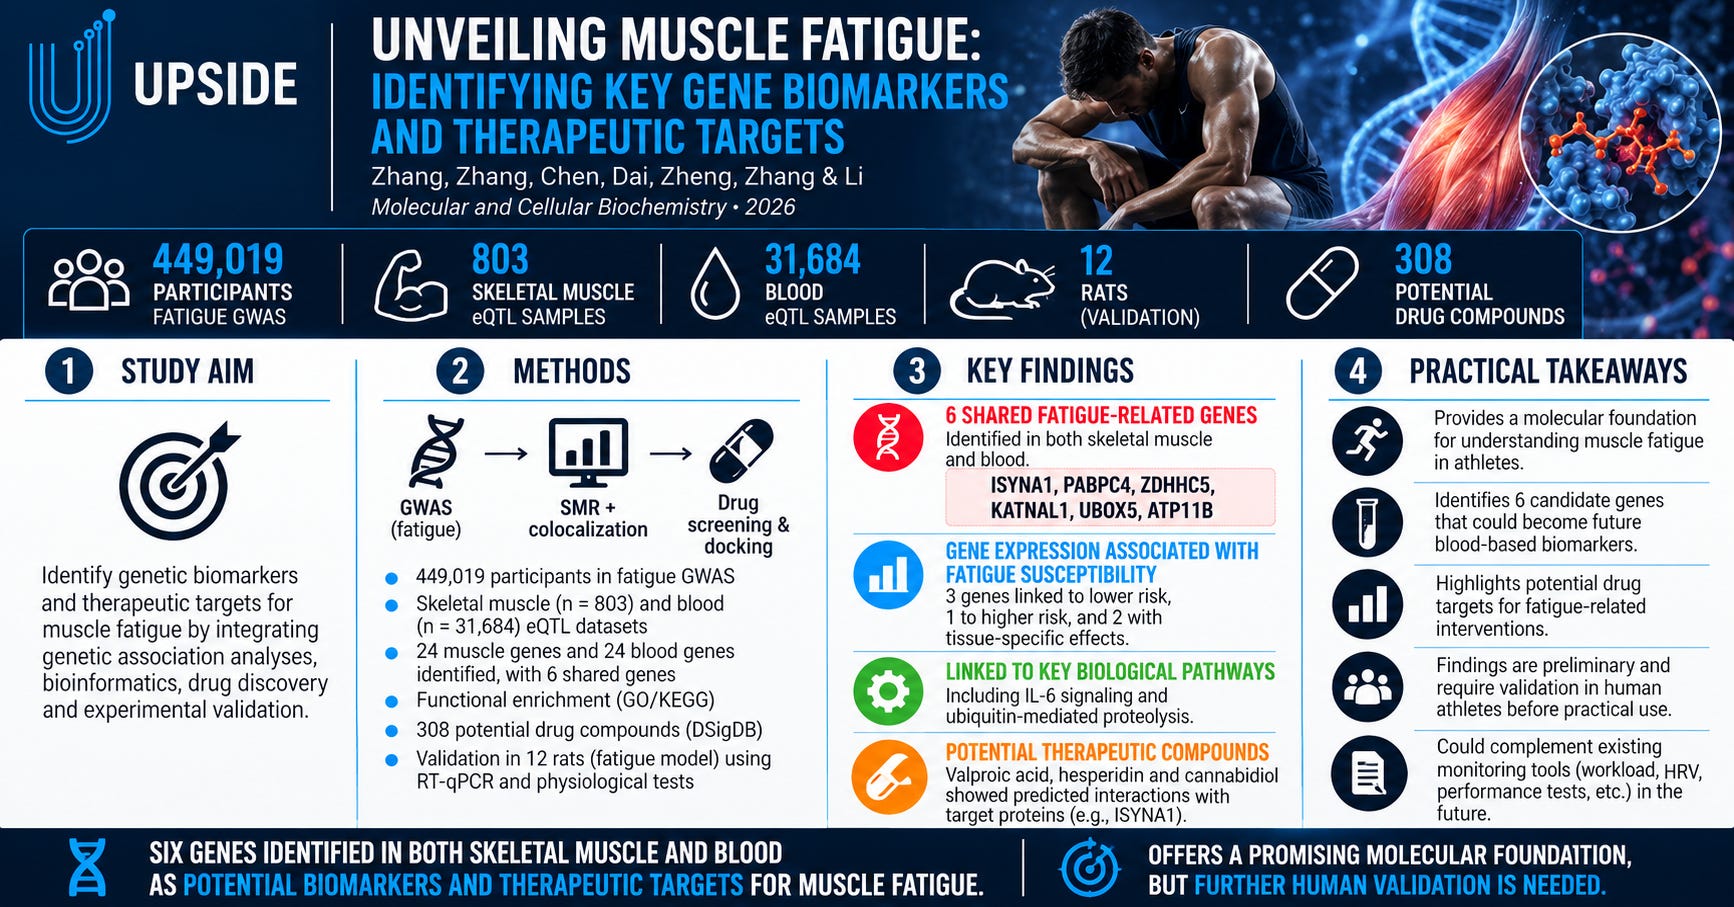
🧬 Upside Sports Science Study (3): Unveiling Muscle Fatigue — Identifying Key Gene Biomarkers and Therapeutic Targets
Published in Molecular and Cellular Biochemistry (2026), Springer Nature.
Study: Unveiling Muscle Fatigue: Identifying Key Gene Biomarkers and Therapeutic Targets
Authors: Yifei Zhang, Zehan Zhang, Xiaoyao Chen, Miao Dai, Yuxiao Zheng, Weiyue Zhang and Feng Li.
Institution: Beijing University of Chinese Medicine, China.
Click on the below button to download the Full study:
🧩 Introduction
Muscle fatigue is one of the most important challenges facing elite athletes and sports performance departments.
Whether in the NBA, NFL, NHL, MLS, or European soccer, understanding fatigue is essential for managing training loads, optimizing recovery, maintaining performance, and supporting injury-risk management.
Today, professional teams rely on technologies such as GPS, force plates, athlete management systems, heart rate monitoring, blood biomarkers, and subjective wellness questionnaires to assess fatigue and recovery.
But what if teams could identify fatigue at a deeper biological level, by examining the genes associated with fatigue susceptibility?
A new 2026 study published in Molecular and Cellular Biochemistry investigated this possibility.
Researchers from Beijing University of Chinese Medicine used genetic association analysis, bioinformatics, molecular modeling, and animal experiments to identify potential molecular biomarkers of fatigue.
Their research identified six genes associated with fatigue in both skeletal muscle and blood, raising the possibility that future fatigue-monitoring approaches could incorporate molecular biomarkers alongside existing performance technologies.
The researchers also explored potential therapeutic compounds that interact with some of these genetic targets.
However, these findings remain preliminary. The study did not establish a validated blood test for athletic fatigue, demonstrate that any treatment improves recovery, or evaluate professional athletes.
🧪 Study Overview
Design: Genetic association and computational drug-discovery study, supported by experimental validation in a rat model of physical fatigue.

Genetic Data Sources
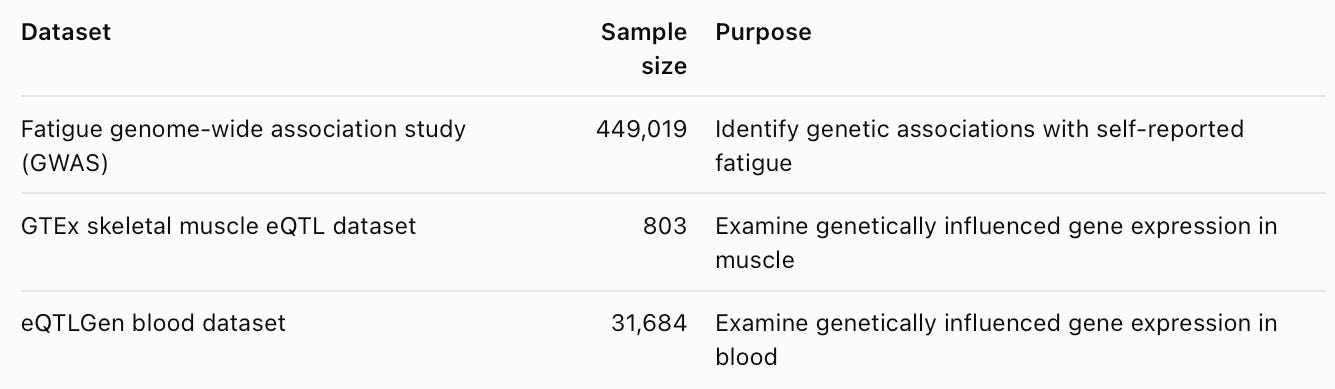
These datasets were analyzed computationally. They do not represent 449,019 athletes undergoing exercise-fatigue testing.
Research Methods
The study involved five main stages:
Summary-data-based Mendelian randomization (SMR): Investigated associations between genetically predicted gene expression and fatigue.
Bayesian colocalization: Evaluated whether fatigue and gene-expression associations could share underlying genetic variants.
Functional enrichment analysis: Explored biological pathways associated with fatigue-related genes.
Drug screening and molecular docking: Identified compounds with potential interactions involving candidate proteins.
Animal validation: Examined muscle fatigue and gene expression in 12 male Wistar rats, divided into control and fatigue groups.
The experimental evaluation included grip strength, exhaustive swimming performance, muscle glycogen, blood biochemical markers, and gene-expression measurements.
📊 Key Findings
1. Researchers Identified Six Potential Fatigue-Related Gene Biomarkers
The most important finding was the identification of six genes associated with fatigue in both skeletal muscle and blood.
Genetic discovery pipeline
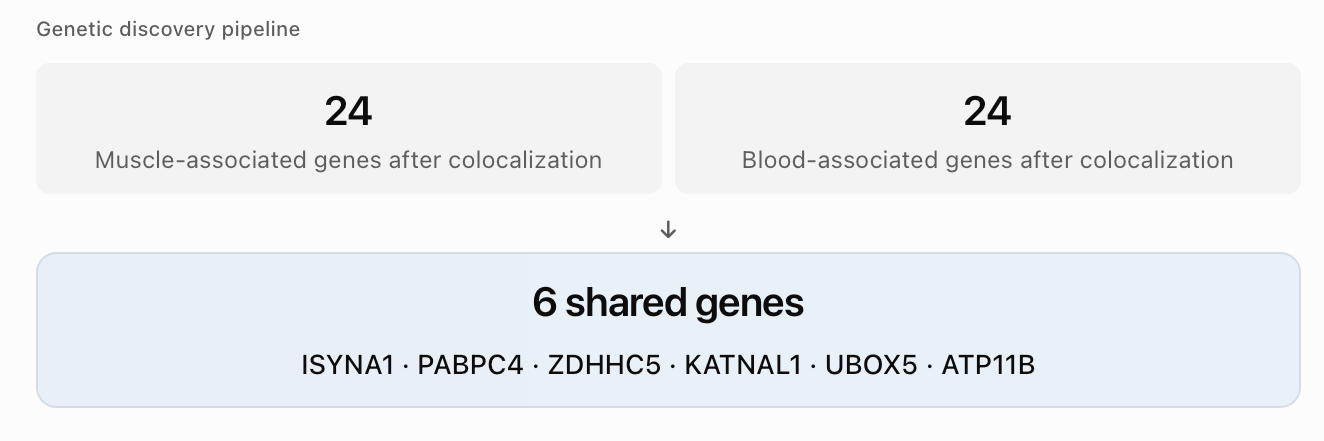
The six genes were:
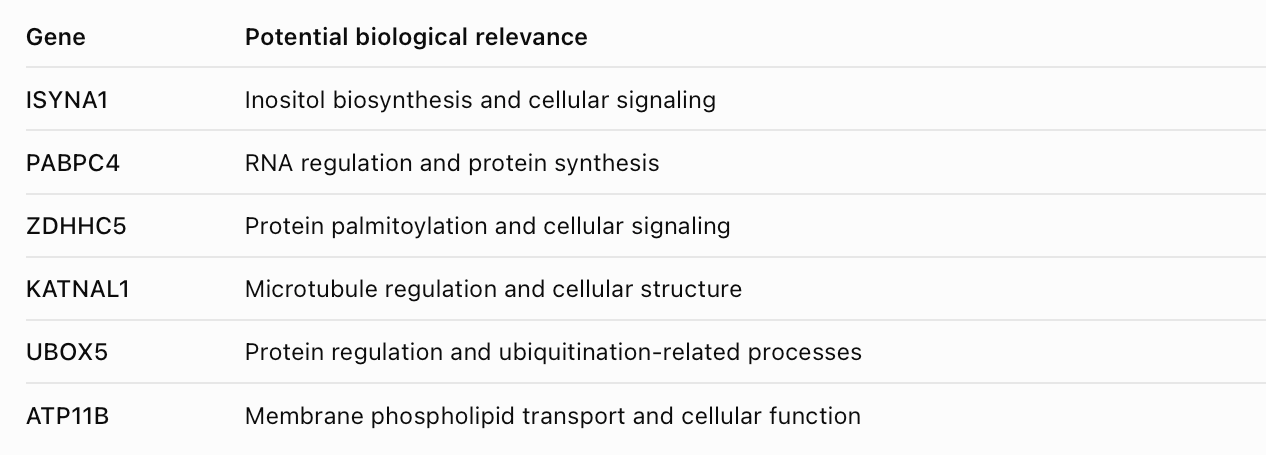
These biological functions help explain why the genes may warrant further investigation. They do not establish the mechanism by which each gene contributes to exercise-induced fatigue.
Implication: The findings provide a starting point for developing molecular approaches to fatigue assessment, but further human validation is essential.
2. Gene Expression Was Associated With Different Levels of Fatigue Susceptibility
The researchers identified differences in how individual genes were associated with fatigue.
Three genes showed consistent associations with lower fatigue susceptibility when genetically predicted expression was higher:
ISYNA1
PABPC4
UBOX5
ATP11B showed an association with increased fatigue susceptibility.
Interestingly, ZDHHC5 and KATNAL1 showed different directions of association between skeletal muscle and blood.
Selected odds ratios for genetically predicted expression
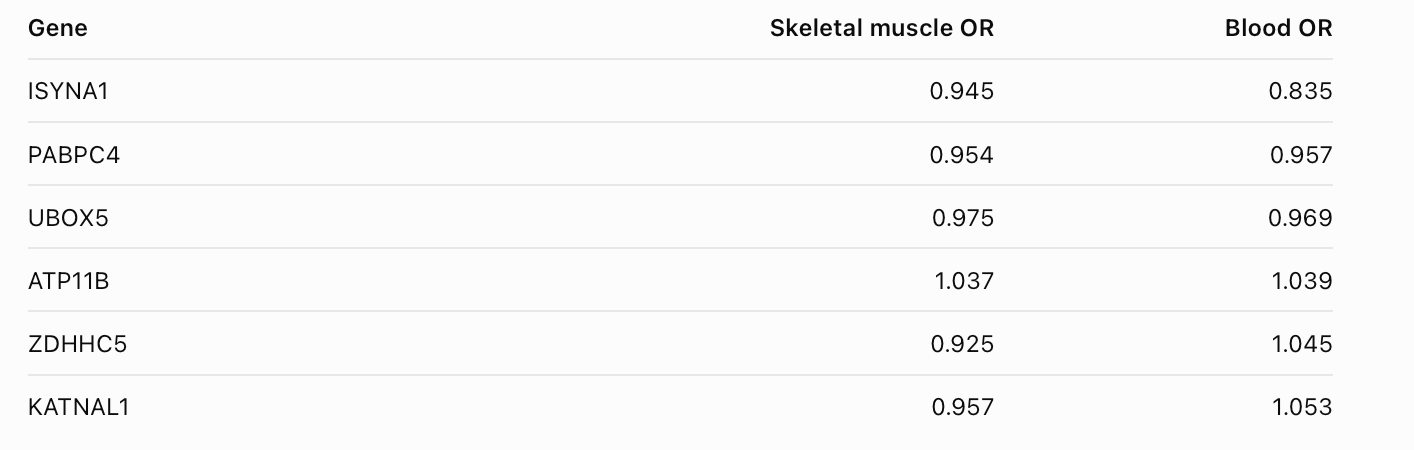
An odds ratio below 1 indicates an association with lower fatigue susceptibility, while a value above 1 indicates an association with higher susceptibility.
These estimates concern the study’s self-reported fatigue phenotype. They should not be interpreted as predicted changes in an athlete’s fatigue after training.
Practical implication: The relationship between gene expression and fatigue may depend on the tissue being examined. Blood measurements may not always reflect what is happening inside skeletal muscle.
3. Fatigue-Related Genes Were Linked to Inflammatory and Protein-Regulation Pathways
Functional enrichment analysis identified several biological processes associated with the genes detected in skeletal muscle.
Two particularly relevant areas were:
Interleukin-6 (IL-6) signaling
IL-6 is involved in inflammatory and exercise-related signaling. The researchers identified enrichment in IL-6-mediated signaling pathways, cellular responses to IL-6, and related biological processes.
Ubiquitin-mediated proteolysis
The study also identified enrichment in processes associated with protein ubiquitination and protein degradation.
These pathways may be relevant to understanding the cellular processes associated with fatigue and muscle function.
However, pathway enrichment does not prove that IL-6 signaling or protein degradation caused fatigue in the study population.
4. Animal Experiments Confirmed Significant Changes in the Six Candidate Genes
The researchers developed a fatigue model involving 12 male Wistar rats.
Compared with controls, fatigued rats demonstrated:
Reduced grip strength.
Shorter exhaustive swimming duration.
Reduced muscle glycogen.
Elevated blood lactate.
Elevated creatine kinase, blood urea nitrogen, and lactate dehydrogenase.
Reduced quadriceps muscle fiber cross-sectional area.
These results supported the presence of physical fatigue and associated physiological changes in the experimental model.
Importantly, all six candidate genes demonstrated statistically significant differences in skeletal muscle expression.
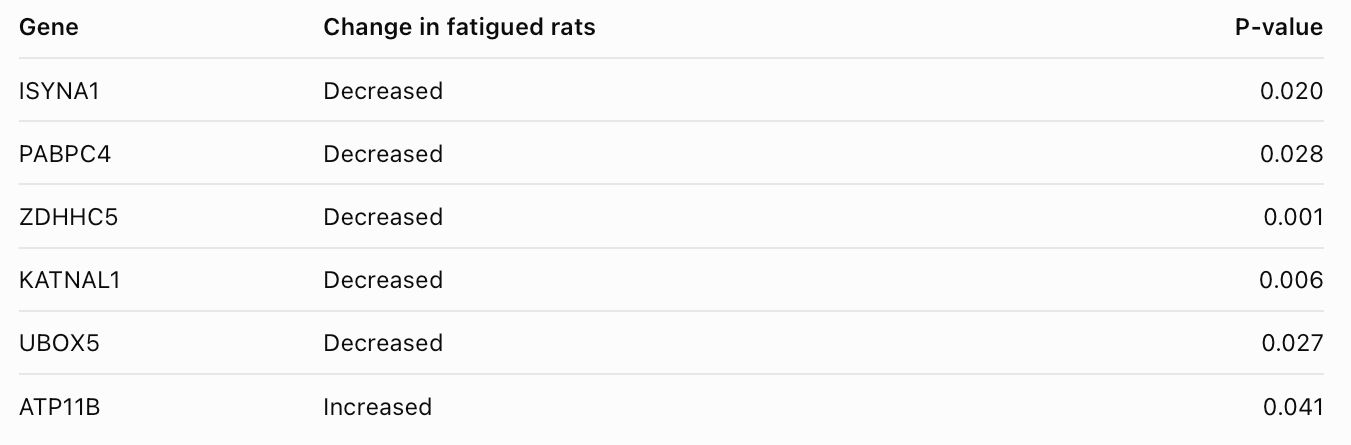
The direction of these changes broadly supported the researchers’ candidate-gene findings.
Implication: The experimental results strengthen the biological plausibility of the six genes as fatigue-associated markers, but animal gene-expression changes do not establish diagnostic performance in humans.
5. Researchers Identified Potential Compounds That Interact With Fatigue-Related Targets
The study also explored whether the identified genes could help researchers discover new therapeutic approaches to muscle fatigue.
Using the Drug Signatures Database (DSigDB), researchers identified 308 potential chemical compounds associated with the six candidate genes.
Among the compounds investigated were valproic acid, hesperidin, and cannabidiol.
The researchers then performed molecular docking simulations to evaluate potential interactions between these compounds and selected target proteins.
Selected molecular docking results

More negative docking energies suggest stronger predicted binding under the modeling conditions.
The researchers identified ISYNA1 as a potentially important therapeutic target because several compounds demonstrated predicted interactions with it.
However, none of these compounds was administered as a treatment in the animal experiment, and no therapeutic efficacy was demonstrated.
Molecular docking does not establish that a compound reduces fatigue, accelerates recovery, or is safe or appropriate for athletes.
This distinction is especially important in elite sports, where medication safety, side effects, and anti-doping regulations must be considered.
6. Blood-Based Gene Biomarkers Could Become an Important Area of Future Research
One of the most interesting aspects of the study is that the six candidate genes were associated with fatigue in both skeletal muscle and blood.
Collecting skeletal muscle samples is invasive and generally impractical for routine athlete monitoring.
Blood samples, by comparison, are much more accessible.
This creates an opportunity to investigate whether blood-based molecular measurements could eventually provide additional information about fatigue-related biological processes.
For example, future studies could explore whether changes in blood gene expression are associated with:
Fatigue following intensive training or competition.
Recovery following congested match schedules.
Changes in neuromuscular performance.
Persistent fatigue during rehabilitation.
Individual differences in responses to training loads.
These are proposed future applications, not capabilities demonstrated by the current study.
The researchers did not measure blood expression of the six genes longitudinally during athlete training or recovery. They also did not establish diagnostic thresholds, sensitivity, specificity, or individual prediction accuracy.
🧠 Implications for Elite Sports Teams and Practitioners
For Heads of Sports Performance
The study introduces a potential additional dimension to athlete monitoring: molecular biology.
Most performance departments currently evaluate fatigue through a combination of external workload, physiological measurements, neuromuscular testing, and athlete feedback.
In the future, molecular biomarkers could potentially complement these measurements.
However, the first step would be to establish whether the identified genes reliably change in response to exercise-induced fatigue in human athletes.
For Strength & Conditioning Coaches
The research raises questions about why athletes may respond differently to similar training loads.
Two players completing comparable workloads can experience different levels of perceived fatigue and recovery.
Genetic and molecular factors may contribute to this variability, alongside sleep, nutrition, conditioning, training history, and other influences.
Future research could investigate whether the six candidate genes help explain these differences.
At present, the study does not justify changing training prescriptions based on an athlete’s gene expression or genetic profile.
For Athletic Trainers and Rehabilitation Specialists
Understanding the molecular processes associated with fatigue could eventually contribute to more personalized rehabilitation strategies.
Potential research applications include monitoring recovery following prolonged inactivity, identifying biological responses to progressive exercise, and investigating persistent fatigue during return-to-play.
Nevertheless, the study did not evaluate injured athletes or test whether these biomarkers predict reinjury or rehabilitation outcomes.
For Sports Scientists and Performance Analysts
The findings highlight the possibility of integrating molecular information with existing performance datasets.
Future research could investigate relationships between candidate gene expression and:
GPS-derived running loads and sprint exposure.
Countermovement jump and force-plate metrics.
Heart rate and heart rate variability.
Subjective wellness and fatigue questionnaires.
Sleep and recovery measurements.
Such work would help determine whether molecular biomarkers provide information beyond established monitoring methods.
🚀 Implications for Sports Technology Companies
This study could have longer-term implications for several areas of sports technology.
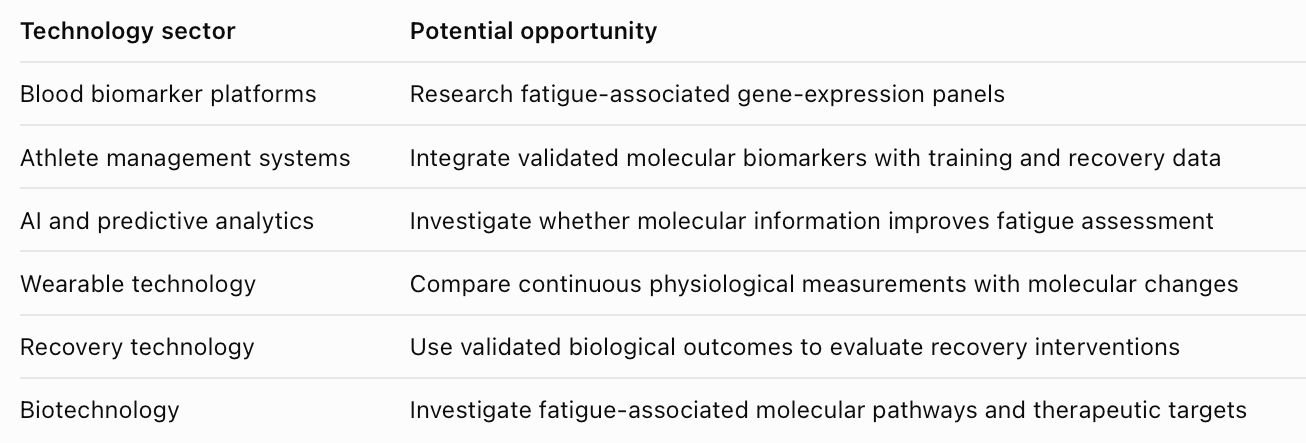
One particularly interesting opportunity concerns the intersection of AI, genomics, and athlete monitoring.
For example, future systems might combine workload information, sleep, neuromuscular performance, and molecular measurements to build more comprehensive models of athlete recovery.
But these models would require substantial validation before being used to guide decisions in professional sports.
📌 Recommendations
For Professional Sports Teams
Continue using validated workload, neuromuscular, physiological, and subjective fatigue measurements.
Monitor emerging research on gene-expression biomarkers and muscle fatigue.
Explore collaborations with universities specializing in exercise physiology, molecular biology, and genomics.
Avoid implementing genetic fatigue scores or treatment decisions based on these six genes without clinical and sport-specific validation.
Consider the privacy and ethical implications of collecting athletes’ genetic or molecular data.
For Universities and Research Laboratories
Replicate the findings in human athletes.
Evaluate the six candidate genes before and after exercise.
Investigate gene-expression changes during recovery periods.
Compare blood gene expression with skeletal muscle responses.
Examine whether biomarkers differ between trained and untrained populations.
Determine whether these biomarkers offer predictive value beyond existing fatigue measurements.
For Sports Technology Startups
Explore partnerships with molecular diagnostics laboratories.
Investigate the feasibility and reproducibility of blood-based gene-expression measurements.
Evaluate whether molecular markers improve fatigue classification or recovery assessment.
Prioritize longitudinal validation rather than relying on single-time-point measurements.
Avoid commercial claims about fatigue diagnosis, injury prediction, or treatment until supported by appropriate human evidence.
For Sports Medicine and Rehabilitation Departments
Monitor research into the biological mechanisms underlying fatigue.
Continue using comprehensive assessments rather than isolated biomarkers.
Evaluate future molecular tests based on their clinical validity, reliability, and relevance to individual athletes.
Ensure that any potential pharmacological intervention is assessed for safety, medical appropriateness, and anti-doping compliance.
⚠️ Limitations
The study has several important limitations.
1. Self-reported fatigue phenotype: The primary genetic analysis used a GWAS of self-reported fatigue, not direct measurements of exercise-induced muscle fatigue in athletes.
2. No human athletic validation: The researchers did not test the six candidate genes in professional or recreational athletes undergoing training or competition.
3. Small animal sample: Experimental validation involved only 12 male rats, with six animals in each group.
4. Blood and muscle differences: Two genes, ZDHHC5 and KATNAL1, showed opposite directions of genetic association between blood and skeletal muscle.
5. No validated diagnostic test: The study did not establish whether measuring these genes can accurately distinguish fatigued from recovered individuals.
6. No longitudinal recovery analysis: The researchers did not track how gene expression changes throughout exercise and recovery in human athletes.
7. Computational drug predictions: Drug candidates were identified through database screening and molecular docking, without experimental evidence of treatment effectiveness.
8. Limited causal certainty: Although SMR and colocalization strengthen genetic associations, they do not conclusively establish the biological mechanisms or prove that modifying these genes will change fatigue.
9. No injury prediction: The study did not investigate whether these biomarkers predict muscle injuries or other sports-related injuries.
Future studies will need to address these limitations before the findings can be translated into practical applications for elite sports.
✅ Conclusion
This 2026 study provides an interesting contribution to our understanding of the molecular mechanisms potentially associated with fatigue.
Using genetic association analyses, computational modeling, and experimental validation in rats, researchers identified six candidate genes linked to fatigue in both skeletal muscle and blood:
ISYNA1, PABPC4, ZDHHC5, KATNAL1, UBOX5, and ATP11B.
The study also highlighted biological pathways involving inflammatory signaling and protein regulation, while identifying potential molecular targets for future therapeutic research.
For elite sports, the findings raise the possibility that future athlete-monitoring systems could incorporate molecular biomarkers alongside GPS, force plates, wearables, and subjective wellness measurements.
However, there remains a substantial gap between identifying fatigue-associated genes and developing clinically validated tools that can guide training, recovery, or injury-risk decisions.
At Upside, we believe one of the most interesting opportunities for sports science and sports technology will be the integration of multiple layers of athlete data, from external workload and biomechanics to physiology and, potentially, molecular biology.
The future of athlete monitoring may not simply be about measuring how much work an athlete performs, but also understanding how their body responds to that work at a cellular and molecular level.
You may also like:
📚 Upside Studies: (1) NBA / FIBA Study: S&C Coaches’ Warm-Up Practices. (2) NFL Study: ACL Injuries (3) Study: Hamstring strain injuries (HSIs)

🏀 Upside Study: A Cross-National Survey of Basketball Strength and Conditioning Coaches’ Warm-Up Practices
📚 Upside Analysis: Leadership Skills Development - 4 Case Studies: The San Antonio Spurs (NBA), The Tampa Bay Lightning (NHL), The Seattle Seahawks (NFL), The New England Patriots (NFL)

Case Study #1: The San Antonio Spurs: A Culture Built on Stability and Intentional Mentorship