
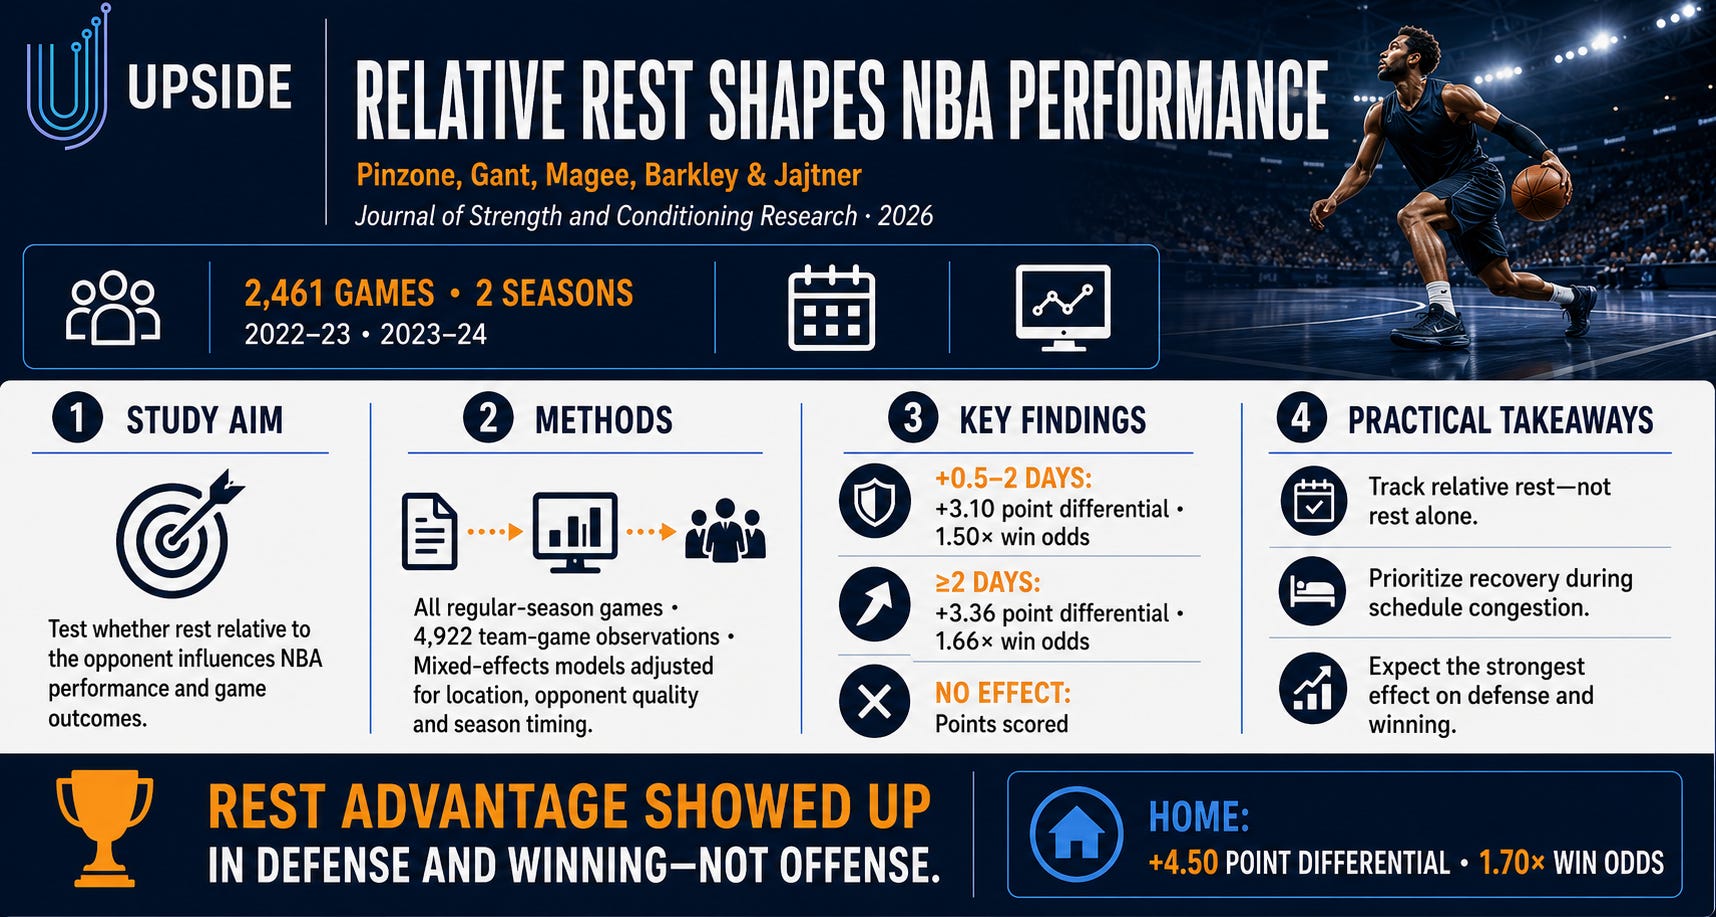
(1) 🏀 Upside Basketball Study: Relative Rest Influences NBA Performance and Game Outcomes
Published in the Journal of Strength and Conditioning Research (2026) by Anthony G. Pinzone, Ryan W. Gant, Megan K. Magee, Jacob E. Barkley and Adam R. Jajtner.
🧩 Introduction
Does having more rest than an opponent provide a meaningful competitive advantage in the NBA?
This study examined every regular-season game from the 2022–23 and 2023–24 NBA seasons to determine how relative rest influenced scoring, defense, point differential and the likelihood of winning.
Rather than looking only at how many days a team had between games, the researchers introduced the Relative Rest Index—or RRI—which compares one team’s rest with its opponent’s rest.
The findings were clear: teams with a relative rest advantage had better point differentials and higher odds of winning. The effect appeared to be driven more by defensive performance than offensive scoring.
Authors:
Anthony G. Pinzone
Ryan W. Gant
Megan K. Magee
Jacob E. Barkley
Adam R. Jajtner
Institutions:
California State University San Marcos
Kent State University
Download the full study by clicking on the link below:
🧪 Study Overview
Design: Retrospective observational analysis of NBA regular-season games.
Seasons analyzed:
2022–23
2023–24
Sample:
2,461 games
4,922 team-game observations
All 30 NBA teams
Data source: Basketball-Reference, with game dates and times checked against NBA.com when necessary.
Outcomes analyzed:
Game result
Point differential
Points scored
Points allowed
The statistical models also accounted for:
Home versus away games
Opponent quality
Stage of the season
Competitive season
Repeated observations within the same game
📊 What Is the Relative Rest Index?
The Relative Rest Index compares a team’s rest interval with the rest interval of its opponent:
RRI = Team’s days of rest − Opponent’s days of rest
For example:
RRI of +2: The team had two more rest days than its opponent.
RRI of 0: Both teams had approximately equal rest.
RRI of −2: The team had two fewer rest days than its opponent.
The researchers divided teams into five categories:
−2 days or less
−2 to −0.5 days
−0.5 to +0.5 days
+0.5 to +2 days
+2 days or more
Teams with an RRI of −2 days or less served as the reference group.
📈 Key Findings
🏆 More Relative Rest Increased the Odds of Winning
Compared with teams that had at least two fewer rest days than their opponents:
Teams with a 0.5–2-day rest advantage had 1.50 times the odds of winning.
Teams with a rest advantage of at least two days had 1.66 times the odds of winning.
The unadjusted results followed the same pattern:
Teams with a 0.5–2-day advantage won 54.5% of their games.
Teams with an advantage of at least two days won 58.1%.
Teams with a disadvantage of at least two days won only 42.1%.
These associations remained after accounting for game location, opponent quality and the point in the season when the game was played.
➕ Rest Advantage Improved Point Differential
Teams with more rest than their opponents also produced better scoring margins.
Compared with teams at a rest disadvantage of at least two days:
An RRI of 0.5–2 days was associated with a 3.10-point improvement in point differential.
An RRI of at least two days was associated with a 3.36-point improvement.
In a league where many games are decided by only a few possessions, a three-point change can be competitively meaningful.
🛡️ The Strongest Effect Appeared on Defense
Relative rest was associated with fewer points allowed.
Compared with teams at a disadvantage of at least two days:
Teams with approximately equal rest allowed 2.41 fewer points.
Teams with a 0.5–2-day rest advantage allowed 3.27 fewer points.
This suggests that rest may influence defensive performance through factors such as:
Transition effort
Defensive rotations
Closeouts
Communication
Rebounding
Decision-making
Repeated high-intensity movements
The study did not measure these mechanisms directly, so they should be treated as possible explanations rather than proven causes.
🎯 More Rest Did Not Significantly Increase Points Scored
Relative rest was not significantly associated with points scored.
This was one of the study’s most important findings. The competitive advantage associated with relative rest appeared to come primarily through better defense and overall point differential, rather than an increase in offensive production.
🏠 Home-Court Advantage Remained Powerful
Playing at home was associated with:
A 4.50-point improvement in point differential
2.27 more points scored
2.26 fewer points allowed
1.70 times the odds of winning
Home teams won 56.1% of the games included in the analysis.
⚔️ Opponent Quality Still Mattered
Playing against an opponent with a stronger recent winning percentage was associated with:
A lower point differential
Fewer points scored
More points allowed
Lower odds of winning
This reinforces the importance of evaluating rest within the context of opponent quality rather than treating the schedule as the only factor affecting performance.
📅 The Results Were Consistent Across Both Seasons
The researchers found no meaningful difference in the relationship between RRI and performance across the 2022–23 and 2023–24 seasons.
The NBA introduced policies intended to encourage greater player availability before the 2023–24 season, but the relationship between relative rest and team performance did not meaningfully change.
The study also did not provide strong evidence that load-management restrictions caused better or worse team performance.
🧠 Implications for NBA Teams and Practitioners
The study suggests that teams should evaluate recovery relative to their upcoming opponent.
Knowing that a team has two days of rest is useful, but it does not provide the complete competitive context. Two days could represent an advantage if the opponent is playing on consecutive nights—or a disadvantage if the opponent has been off for four days.
RRI provides a simple scheduling metric that can be added to existing performance-monitoring systems.
It may help teams identify games in which they are more likely to experience:
Defensive fatigue
Reduced movement quality
Slower decision-making
Lower physical readiness
A competitive disadvantage late in the game
It may also support decisions involving practice intensity, recovery, travel, tactical preparation and rotation planning.
However, RRI is a team-level scheduling metric. It does not replace individual athlete monitoring or prove that a particular player is recovered.
📌 Recommendations
For Performance and Medical Staff
Calculate RRI before every game.
Add opponent rest to existing schedule-congestion dashboards.
Combine RRI with player minutes, workload, travel, sleep and recovery data.
Pay particular attention to defensive readiness when the team has a substantial rest disadvantage.
Avoid assuming that every athlete responds to rest in the same way.
For Strength and Conditioning Staff
Reduce unnecessary training load during periods of negative RRI.
Prioritize recovery between games during congested schedule periods.
Monitor neuromuscular readiness before games with a rest disadvantage.
Preserve high-quality tactical work without adding avoidable physical fatigue.
Individualize recovery according to recent playing time and athlete history.
For Coaches
Consider relative rest when planning rotations and practice intensity.
Prepare for possible defensive declines when facing a more-rested opponent.
Emphasize transition defense, communication and rotational discipline.
Avoid treating RRI as a reason to expect a loss; use it as one contextual input.
Consider whether tactical adjustments can reduce the physical cost of schedule disadvantages.
For Performance Analysts
Track relative rest rather than team rest alone.
Separate offensive and defensive outcomes when evaluating schedule effects.
Include home-court advantage and opponent quality in internal models.
Examine whether RRI has a greater effect in the fourth quarter or during clutch situations.
Explore position-specific and player-specific responses to schedule congestion.
⚠️ Limitations
The authors identified several important limitations:
The study was observational and cannot prove that relative rest caused the results.
Only two NBA seasons were included.
Detailed team travel itineraries were unavailable.
The analysis did not include time-zone changes or whether teams returned home between road games.
Practice and training loads were not included.
Player availability, injuries, rotation age and individual recovery strategies were not examined.
The study evaluated team-level outcomes rather than individual performance.
Rest duration does not necessarily represent sleep quality or physiological recovery.
Other factors, including tactical matchups and roster changes, may have influenced game results.
Future research should compare RRI directly with conventional rest intervals and investigate its influence across different NBA eras, travel schedules, players and game situations.
✅ Conclusion
Relative rest appears to influence team performance and game outcomes in recent NBA competition.
Teams with more rest than their opponents produced better point differentials and higher odds of winning. The effect was most visible in points allowed, suggesting that rest advantage may be expressed more strongly through defensive performance than offensive scoring.
RRI is not a complete recovery metric and should not be used in isolation. Nevertheless, it provides teams with an inexpensive and practical way to add opponent context to schedule and recovery analysis.
The central takeaway is simple:
It is not only how much rest your team has that matters. It is how much rest your team has relative to its next opponent.
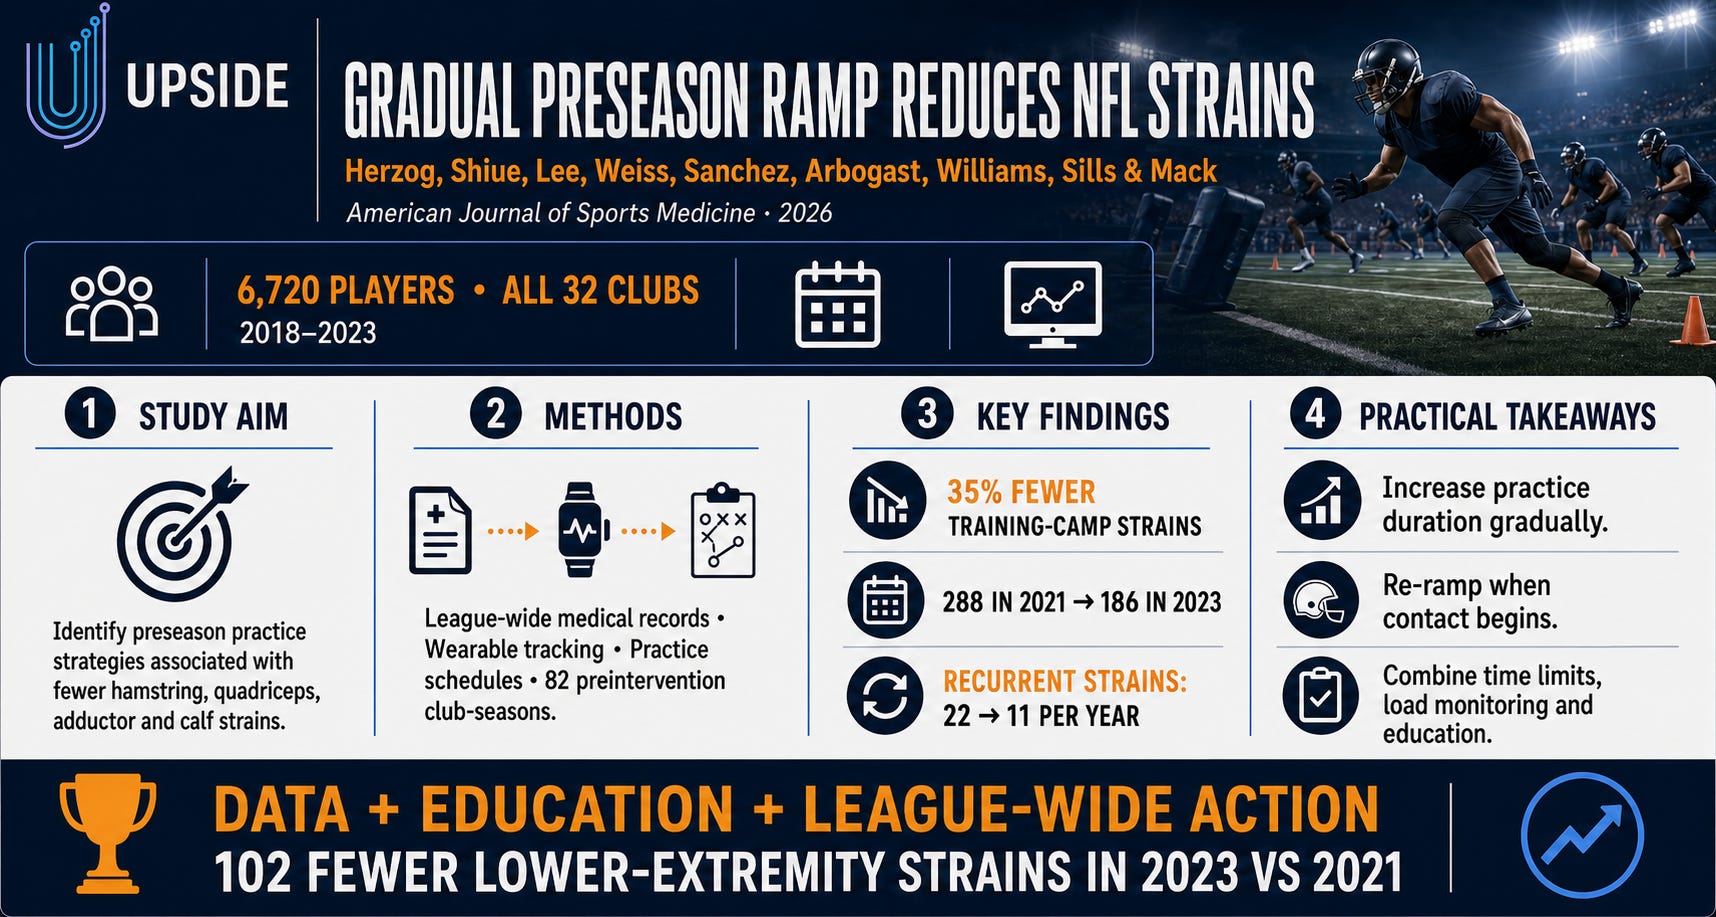
(2) 🏈 Upside NFL Study: Gradual Preseason Practice Acclimation Reduces Lower-Extremity Strains
Published in the American Journal of Sports Medicine (2026) by Mackenzie M. Herzog, Kristin Y. Shiue, Rebecca Y. Lee, Leigh Weiss, Erin Sanchez, Kristy B. Arbogast, Tyler Williams, Allen K. Sills and Christina D. Mack.
🧩 Introduction
Approximately one in four NFL players sustains a lower-extremity strain each season. Nearly 20% of those injuries occur during the short training-camp period at the beginning of preseason.
Could gradually increasing practice duration help reduce that injury burden?
This study combined league-wide medical records, wearable tracking data and practice schedules to identify preseason strategies associated with fewer hamstring, quadriceps, adductor and calf strains.
Based on the initial findings, the NFL and NFL Players Association implemented a mandatory league-wide practice acclimation ramp before the 2022 preseason.
Training-camp lower-extremity strains subsequently fell by 35%—from 288 in 2021 to 186 in 2023.
Authors:
Mackenzie M. Herzog
Kristin Y. Shiue
Rebecca Y. Lee
Leigh Weiss
Erin Sanchez
Kristy B. Arbogast
Tyler Williams
Allen K. Sills
Christina D. Mack
Organizations represented:
IQVIA
New York Giants
Biomechanics Consulting & Research
Children’s Hospital of Philadelphia
Minnesota Vikings
National Football League
Download the full study by clicking on the link below:
🧪 Study Overview
Design: Observational descriptive epidemiology study followed by evaluation of a league-wide intervention.
Study period: 2018–2023 NFL seasons.
Sample:
6,720 unique players
All 32 NFL clubs
82 club-seasons included in the preintervention practice-strategy analysis
Complete league-wide injury counts and rates available for all clubs
Preintervention period: 2018–2021
Postintervention period: 2022–2023
Data sources:
NFL league-wide electronic medical records
Wearable player-tracking data
Club practice schedules
NFL activity calendars
Tracking information came from devices supplied by:
Catapult
Zebra Technologies
Polar
Kinexon
STATSports
The researchers used the wearable data primarily to determine individual participation and practice duration.
🦵 Injuries Examined
The primary outcome was lower-extremity muscle strains involving the:
Hamstrings
Quadriceps
Adductors
Calf muscles
The study included strains regardless of whether they resulted in missed participation.
The researchers also examined:
Time-loss lower-extremity strains
Time-loss noncontact injuries
Recurrent lower-extremity strains during the regular season
Injuries across the entire preseason and regular season
A recurrent strain was defined as another injury to the same muscle on the same side after the player had returned to full participation.
📊 Five Preseason Practice Strategies
The researchers examined how teams structured the first three practices of training camp between 2018 and 2021.
Five general strategies were identified:
1. Gradual 15-Minute Ramp
Practice duration increased by approximately 15 minutes with each of the first three practices.
2. Less Than 10-Minute Ramp
Practice duration increased each day, but by less than 10 minutes.
3. High-Low Duration Variation
Teams alternated practice duration, with the second practice longer than the first and third.
4. Stable Duration
Practice duration remained relatively consistent across the opening sessions.
5. Reverse Ramp
Practice duration decreased each day, meaning the longest practice occurred at the beginning of training camp.
The first three strategies were classified as gradual acclimation approaches.
📈 Key Findings
📉 Gradual Acclimation Was Associated With Fewer Strains
Teams using a gradual 15-minute ramp, a smaller ramp or high-low variation experienced lower training-camp strain rates than teams using stable-duration or reverse-ramp strategies.
The gradual approaches were associated with a 19% lower rate of lower-extremity strains per club practice:
Incidence rate ratio: 0.81
95% confidence interval: 0.68–0.95
P = .01
The result remained consistent after accounting for total practice time.
This is important because the teams following gradual strategies accumulated a similar amount of total training-camp practice time. The difference was not necessarily how much they practiced overall, but how that exposure was distributed during the opening days.
🏥 The Findings Led to a League-Wide Intervention
The preliminary results were presented to coaches, front-office executives and medical and performance staff before the 2022 preseason.
The NFL and NFLPA then worked with experts to introduce a mandatory gradual practice-acclimation ramp through the Collective Bargaining Agreement.
The intervention:
Limited practice duration during the first six training-camp practices.
Gradually increased exposure as players acclimated.
Included a second ramp when padded and contact practices began.
Was supported by individual education sessions with all 32 clubs.
Encouraged teams to consider intensity, distance and position-specific movements—not only practice time.
The educational sessions emphasized the purpose of the intervention rather than treating it only as a time restriction.
📉 Training-Camp Strains Decreased by 35%
League-wide lower-extremity strains during training camp declined from:
288 in 2021
215 in 2022
186 in 2023
That represented:
A 25% reduction during the first year
A further 13% reduction in the second year
A total 35% decrease from 2021 to 2023
102 fewer strains in 2023 than in 2021
⏱️ Time-Loss Strains Also Declined
When the analysis was limited to injuries that caused players to miss participation, the number of strains decreased from:
230 in 2021
187 in 2022
163 in 2023
The largest reductions occurred during the opening stages of training camp:
38% reduction during Week 1
33% reduction during Week 2
These are the periods when athletes are adapting to football-specific training and then integrating contact.
🔁 Recurrent Strains Fell by 50%
The benefits were not limited to training camp.
Recurrent lower-extremity strains during the regular season decreased from:
22 in 2021
11 per year during 2022 and 2023
That represented a 50% reduction in recurrent strains.
The study cannot establish that the acclimation ramp alone produced the reduction, but the finding suggests that improving early-season preparation may have effects extending beyond training camp.
📅 Total Season Strains Declined
From preseason through the end of the regular season, league-wide lower-extremity strain incidence decreased by 19% between 2021 and 2023.
The largest reduction occurred during the active training-camp intervention period, but decreases were also observed later in preseason and during the regular season.
🏟️ Most Clubs Experienced Improvement
Compared with the preintervention seasons:
21 of 32 clubs—66%—had a lower median number of training-camp lower-extremity strains in 2022–2023.
18 clubs—56%—had a lower median number of noncontact time-loss injuries.
The intervention did not eliminate injuries, and not every club improved. However, the league-wide trend was favorable.
🧠 Why the Gradual Ramp May Have Worked
NFL players arrive at training camp with different levels of conditioning and preparation. They must rapidly adapt to:
Football-specific running
Accelerations and decelerations
Sprinting
Cutting
Position-specific movements
Longer practices
Equipment
Contact
A sudden increase in duration and intensity may expose tissues to demands for which they are not fully prepared.
Gradual acclimation allows players to progressively adapt while still reaching similar total practice volumes later in camp.
The study also reinforces an important point: practice duration is only a proxy for load.
A 90-minute high-intensity practice can create different demands from a 90-minute technical session. Teams must still evaluate distance, high-speed running, accelerations, collisions and individual participation.
📌 Recommendations
For Coaches
Avoid scheduling the longest practice on the first day of training camp.
Increase practice exposure gradually during the opening sessions.
Introduce a second ramp when contact or padded practices begin.
Preserve the quality and intensity needed for football preparation while managing duration.
Coordinate practice planning with medical and performance staff.
For Performance Staff
Combine practice-duration limits with individual wearable data.
Monitor total distance, high-speed running, sprint exposure, accelerations and decelerations.
Account for position-specific demands.
Track activities completed outside structured team practice.
Compare each player’s preseason load with their recent training history.
Identify players who require a more individualized acclimation schedule.
For Medical Staff
Monitor early symptoms involving the hamstrings, quadriceps, adductors and calves.
Review previous injuries and recurrence risk before camp.
Communicate emerging problems before they become time-loss injuries.
Integrate medical-record data with workload and participation information.
Monitor athletes closely during the introduction of contact.
For Sports Organizations
Use league-wide data to identify common injury patterns.
Translate research findings into simple, actionable policies.
Educate coaches, executives, medical teams and performance staff together.
Explain the purpose behind new requirements.
Evaluate the intervention after implementation and refine it over time.
Preserve flexibility for teams while establishing evidence-based guardrails.
⚠️ Limitations
The study has several important limitations:
It was observational and cannot prove that the practice ramp caused the reduction in injuries.
Other changes between 2021 and 2023 may have influenced injury trends.
Practice duration is a relatively broad measure of training load.
Practice intensity and activity type can vary substantially within the same duration.
Individual players may have experienced different exposure from the overall club strategy.
Players entered training camp with different conditioning histories.
Age, previous injury, fitness and activities outside practice were not fully incorporated.
Approximately 24% of club-seasons were excluded from the preintervention strategy analysis because of missing or incomplete wearable data.
Wearable data were voluntarily provided during the earlier seasons.
The findings may not directly generalize to college, high school or youth football.
The study only examined selected lower-extremity strains and noncontact injuries.
The study also involved researchers and consultants connected to the NFL, NFLPA, NFL clubs and IQVIA. The paper reports these relationships and notes that the NFL Injury Database is funded by the NFL and NFLPA.
✅ Conclusion
A data-driven, gradual preseason practice ramp combined with league-wide education was associated with a major reduction in lower-extremity strains across the NFL.
Training-camp strains decreased by 35%, producing 102 fewer injuries in 2023 than in 2021. Recurrent regular-season strains also fell by 50%.
The results do not mean that practice time alone determines injury risk. Duration is only one component of load, and the study does not establish causality.
However, the initiative provides a compelling model for professional sports:
Combine medical, scheduling and wearable data.
Identify a modifiable league-wide risk factor.
Translate the finding into a simple intervention.
Educate every organization on how and why to implement it.
Measure the results and refine the approach.
The central takeaway is clear:
Teams may not need to practice less during preseason. They may need to progress practice demands more gradually.
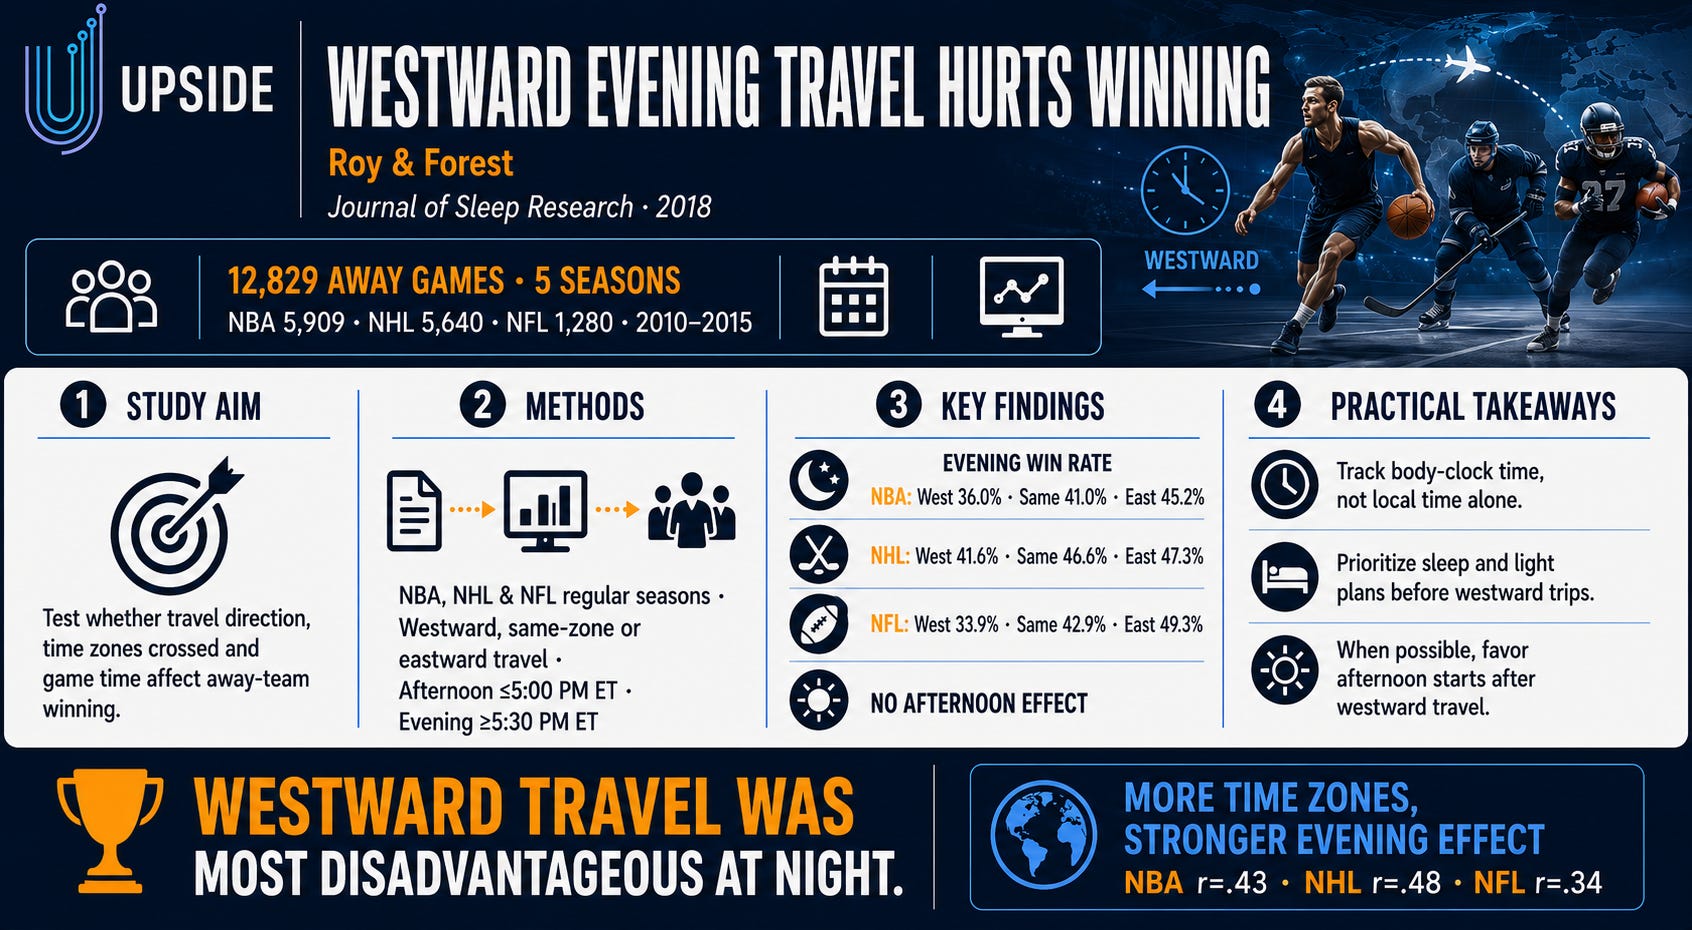
(3) Multi-League Study: Westward Evening Travel Hurts Winning
Study: Greater circadian disadvantage during evening games for NBA, NHL and NFL teams travelling westward
Authors: Jonathan Roy and Geneviève Forest
Journal: Journal of Sleep Research, 2018
DOI: 10.1111/jsr.12565
Download the full study below by clicking on the button below:
Introduction
Professional teams frequently cross one to three time zones during the season. Although these trips are shorter than international travel, the repeated disruption can place athletes out of alignment with their internal body clocks.
This study examined whether travel direction and game time were associated with away-team winning percentages in the NBA, NHL and NFL.
The underlying premise was that many physical and cognitive performance measures peak in the late afternoon. An evening game after westward travel may occur late at night according to the visiting athletes’ internal clocks—when their bodies are beginning to prepare for sleep.
Study overview
The researchers analyzed 12,829 regular-season away games played from 2010 through 2015:
NBA: 5,909 games
NHL: 5,640 games
NFL: 1,280 games
Games were categorized by:
Westward, eastward or same-time-zone travel
One to three time zones crossed
Afternoon games: 5:00 p.m. ET or earlier
Evening games: 5:30 p.m. ET or later
Visiting-team win or loss
The researchers also compared the overall quality of western and eastern teams. They found no significant differences in total winning percentages, suggesting that regional team quality did not explain the primary findings.
Key findings
1. Westward teams recorded the lowest evening win rates

Travel direction was significantly associated with overall winning percentage in the NBA and NHL:
NBA: p < 0.0001
NHL: p = 0.011
NFL: p = 0.058, representing a statistical trend rather than a conventionally significant result
2. The effect was concentrated in evening games
For evening games, travel direction remained significant in:
NBA: p < 0.0001
NHL: p = 0.003
The NFL displayed the same directional pattern, but the result was not statistically significant, potentially because its sample contained far fewer evening games.
By contrast, the researchers found no significant travel-direction effect during afternoon games in any of the three leagues.
3. The number of time zones mattered
For evening games, the number and direction of time zones crossed were significantly associated with winning percentage:
NBA: r = 0.43
NHL: r = 0.48
NFL: r = 0.34
Because westward travel was coded in the negative direction and eastward travel positively, these relationships indicate progressively poorer outcomes toward the west and better outcomes toward the east.
The travel variable explained:
18.5% of variation in NBA winning percentages
23.2% in the NHL
11.3% in the NFL
Why this matters
Local game time does not necessarily represent an athlete’s biological time.
For example, an Eastern-time-zone team playing a 7:30 p.m. game on the West Coast may experience the contest as 10:30 p.m. according to its body clock—particularly without enough time to adapt. That can affect alertness, reaction time, decision-making, strength expression and other performance components.
Eastward travelers may experience the opposite situation: an evening game can occur closer to their late-afternoon biological performance window.
The findings therefore suggest that teams should evaluate schedules through a circadian-time lens, not simply count travel distance or days on the road.
Practical recommendations for teams
Track body-clock time
Record each athlete’s origin time zone, local time, biological time and expected adaptation when evaluating training and competition schedules.
Flag westward evening games
Treat evening competition after westward travel as a potentially higher-risk performance scenario, especially when multiple time zones are crossed.
Build individualized light plans
Strategically timed light exposure—and avoidance of light at inappropriate times—can help move circadian timing in the desired direction.
Protect sleep opportunities
Coordinate flights, hotel arrivals, meals, meetings and treatment schedules so athletes receive sufficient sleep instead of losing recovery time to logistics.
Consider earlier arrival
When the schedule permits, arrive early enough to allow partial adaptation. The appropriate timing will depend on direction, time zones crossed and individual response.
Use afternoon start times strategically
The study found no significant travel-direction effect during afternoon games. When teams or leagues can influence scheduling, earlier games may reduce the disadvantage associated with westward travel.
Monitor individual differences
Chronotype, habitual sleep timing and prior travel may change how athletes respond. Team-level rules should be supplemented by individualized plans.
Important limitations
This was a retrospective observational study, so it demonstrates an association—not proof that circadian misalignment caused the losses.
The analysis also did not comprehensively adjust for opponent strength, injuries, lineup availability, rest differential, back-to-back games, exact flight timing, arrival day or individual sleep and circadian measurements. Its fixed Eastern Time cutoff may not perfectly represent each athlete’s biological phase.
The results should consequently inform travel planning and future research rather than serve as a standalone prediction model.
Conclusion
Across nearly 13,000 away games, westward travel was associated with the poorest winning percentages when NBA, NHL and NFL games were played in the evening. The same disadvantage was not evident during afternoon competition.
The practical message is straightforward:
Travel direction, time zones crossed and biological game time should be treated as performance variables—not merely scheduling details.
You may also like:
📚 Upside Studies: (1) NBA / FIBA Study: S&C Coaches’ Warm-Up Practices. (2) NFL Study: ACL Injuries (3) Study: Hamstring strain injuries (HSIs)

🏀 Upside Study: A Cross-National Survey of Basketball Strength and Conditioning Coaches’ Warm-Up Practices
📚 Upside Analysis: Leadership Skills Development - 4 Case Studies: The San Antonio Spurs (NBA), The Tampa Bay Lightning (NHL), The Seattle Seahawks (NFL), The New England Patriots (NFL)

Case Study #1: The San Antonio Spurs: A Culture Built on Stability and Intentional Mentorship