
🏈 Upside NFL Study: What External Factors Contribute to Achilles Tendon Ruptures During NFL Games?
Published in The Orthopaedic Journal of Sports Medicine (2026) by Kelan Queenan, Spencer DeMedal, Hasala Rannulu, Preston Rogers, Luke Jordan, Sreeram Ravi, Scott Lynch & Robert A. Gallo. The investigation was conducted at Penn State College of Medicine / Penn State Milton S. Hershey Medical Center.
🧩 Introduction
Achilles tendon ruptures are among the most serious injuries NFL players can suffer. They can require prolonged rehabilitation, significantly affect performance and, in some cases, shorten careers.
Previous research has raised questions about whether factors such as artificial turf, accumulated fatigue, game timing and season timing could contribute to Achilles injuries.
This study examined Achilles tendon ruptures occurring during NFL games from 2010 through 2023, specifically investigating four external factors:
Playing surface: natural grass vs. artificial turf
Timing within the NFL season
Quarter of the game
Days of rest before injury
The researchers hypothesized that Achilles ruptures would occur more frequently on artificial turf, during the fourth quarter and later in the regular season.
Authors:
Kelan Queenan, Spencer DeMedal, Hasala Rannulu, Preston Rogers, Luke Jordan, Sreeram Ravi, Scott Lynch & Robert A. Gallo.
Penn State College of Medicine / Department of Orthopaedic Surgery and Rehabilitation, Penn State Milton S. Hershey Medical Center.
You can check out the full study by clicking on the button below:
🧪 Study Overview
Design: Retrospective descriptive epidemiology study.
Study Period: 2010–2023 NFL seasons.
Initial Sample:
1,477 NFL players identified with reported ankle injuries
103 confirmed complete Achilles tendon ruptures
103 players / 103 ankles
Injuries occurred across 101 games
4,600 NFL games analyzed overall
Only complete Achilles tears sustained during preseason, regular-season or postseason games were included. Injuries during practices, organized team activities, scrimmages, summer training and the offseason were excluded.
Data Sources included:
NFL injury reports
NFL.com
ESPN
CBS Sports
Major sports-media reports
Factors Analyzed:
Playing surface
Week of season
Quarter of game
Days of rest
Player age and position
Primary rupture vs. retear
Time between rupture and retirement
📈 Key Findings and Statistical Results
🚨 Achilles Ruptures Have Increased in Recent NFL Seasons
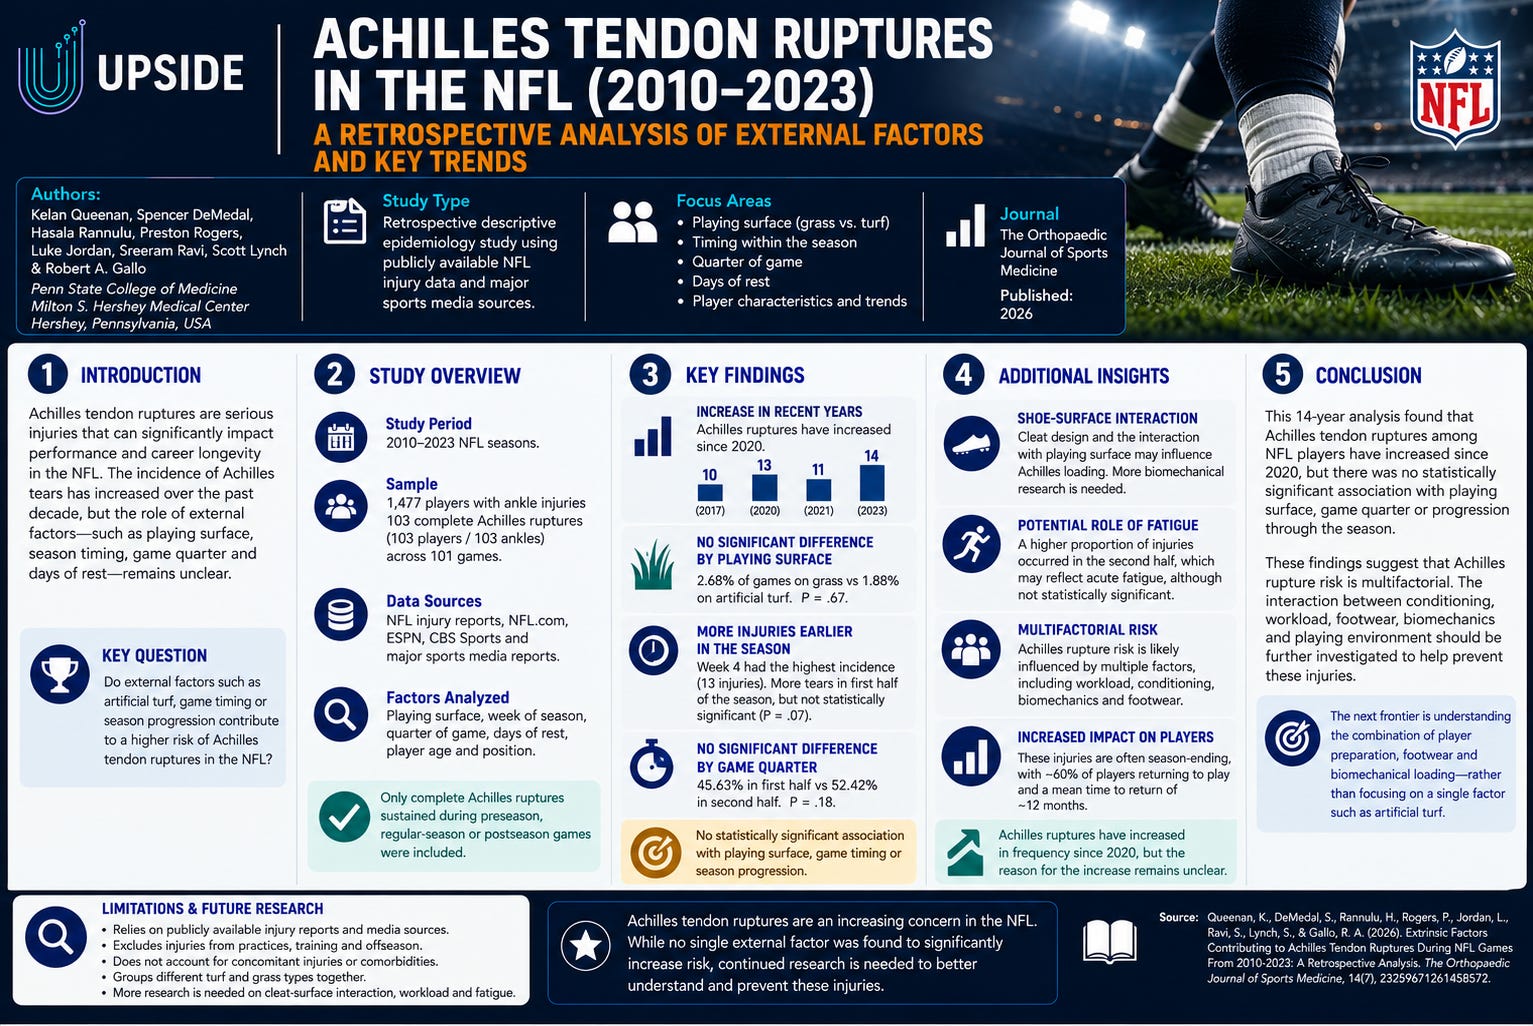
One of the study’s most important observations was the increase in Achilles tendon ruptures in recent years.
The highest number occurred in:
2023: 14 ruptures
2020: 13
2021: 11
2017: 10
Those four seasons accounted for 46.6% of all 103 Achilles ruptures identified across the 14-year study period.
The researchers concluded that Achilles ruptures have increased in frequency since 2020, although the reason for the increase remains unclear.
🌱 Artificial Turf Was NOT Associated With More Achilles Ruptures
Perhaps the most notable result concerns the ongoing debate over artificial turf.
Of 2,050 games played on grass, 55 games (2.68%) involved at least one Achilles rupture.
Of 2,550 games played on artificial turf, 48 (1.88%) involved at least one rupture.
The difference was not statistically significant (P = .67). Extrinsic Factors Contributing …
Therefore, this study did not find evidence that Achilles ruptures occurred more frequently on artificial turf than natural grass.
Importantly, the authors do not conclude that playing surfaces are irrelevant to injury risk generally. Rather, their Achilles-specific analysis did not demonstrate a statistically significant surface association.
📅 More Injuries Occurred Earlier in the Season
Week 4 had the highest number of Achilles ruptures, with 13 injuries (12.62%).
There were also more games involving Achilles ruptures during the first half of the regular season:
Weeks 1–8: 58 games
Weeks 9–18: 28 games
However, the difference between the first and second halves of the regular season did not reach statistical significance (P = .07). Extrinsic Factors Contributing …
This finding ran counter to the researchers’ original hypothesis that ruptures would be more frequent later in the season.
The authors suggest that early-season factors such as preseason preparation, roster turnover, conditioning and changes in preseason structure/workload warrant further investigation.
⏱️ Second-Half Fatigue May Be Worth Further Investigation
The study found:
45.63% of tears occurred during the first half of games.
52.42% occurred during the second half.
1.94% occurred during overtime.
But again, the difference was not statistically significant (P = .18).
The authors discuss tendon fatigue as a potential mechanism. Repetitive loading can produce microstructural damage and reduce the tendon’s ability to withstand stress.
They suggest that the greater observed proportion of second-half injuries could potentially reflect acute fatigue accumulated during a game, although the study does not establish fatigue as a causal factor.
👟 The Shoe-Surface Interaction Could Matter More Than “Turf vs. Grass”
While the study found no significant grass-versus-turf difference, the authors highlight another potentially important area: cleat design and shoe-surface interaction.
Certain footwear designs can affect rotational traction and stiffness. The authors note that increased rotational stiffness could potentially increase ankle torque and Achilles loading.
They argue that additional biomechanical research is needed to examine the interaction between cleat design + playing surface, rather than considering surface alone.
🧠 Implications for NFL Teams and Performance Departments
The study challenges several common assumptions surrounding Achilles injuries.
Most importantly, the findings suggest teams should be cautious about reducing Achilles rupture risk to a single external variable such as artificial turf.
Potential implications include:
Turf alone may not explain Achilles rupture risk.
Early-season preparation and conditioning deserve greater attention.
Acute fatigue during games warrants further investigation.
Footwear and the cleat-surface interaction could represent an important area for biomechanical monitoring and research.
Achilles injury risk is likely multifactorial, requiring teams to consider workload, conditioning, footwear, biomechanics and playing environment together.
These are practical interpretations of the study rather than causal findings established by the research.
📌 Recommendations
For NFL Performance & Medical Staff
Pay particular attention to preseason-to-regular-season workload transitions.
Monitor Achilles and lower-leg loading during early-season preparation.
Avoid assuming artificial turf alone is responsible for Achilles rupture risk.
Evaluate footwear and cleat selection alongside the specific playing surface.
Continue examining whether acute in-game fatigue could alter Achilles loading late in games.
Consider individualized Achilles tendon monitoring for potentially higher-risk players.
For Sports-Tech & Research Companies
There may be opportunities to develop better ways to monitor:
Tendon loading and fatigue
Lower-leg biomechanics
Shoe-surface interaction
Changes in tendon properties
Player-specific workload and recovery
The study specifically calls for additional biomechanical research into the relationship between cleat design and playing surface.
⚠️ Limitations
Several important limitations should be considered.
The researchers relied on publicly available injury reports and media sources, which may contain incomplete or inaccurate information.
The analysis also:
Excluded Achilles ruptures occurring during practices and training.
Did not account for concomitant injuries or comorbidities.
Grouped different artificial surfaces together as “turf” and natural surfaces together as “grass.”
Used games rather than individual player exposures as the primary comparison unit.
Could therefore miss differences between specific turf systems, grass types or individual exposure levels.
✅ Conclusion
This 14-year analysis found that Achilles tendon ruptures among NFL players have increased in frequency since 2020, but the researchers found no statistically significant association with playing surface, game quarter or progression through the season.
Perhaps the most interesting finding for NFL teams is what the study didn’t find: artificial turf was not associated with a significantly higher frequency of Achilles ruptures than natural grass in this dataset.
Instead, the findings reinforce the idea that Achilles rupture risk is likely multifactorial.
For NFL performance departments, the next frontier may therefore be less about asking simply “grass or turf?” and more about understanding the interaction between conditioning, acute fatigue, workload, footwear, biomechanics and the shoe-surface interface.
⚾ Upside MLB Study: Performance After Anterior Cruciate Ligament Reconstruction in MLB Fielders
Research article posted in 2026 by Po-Chun Chi, Min-Hao Sun, Yu-Che Lee, Cheng-Pang Yang, Joe Chih-Hao Chiu & Yi Lu, examining how ACL reconstruction affects MLB fielders’ baserunning, defensive and batting performance.
🧩 Introduction
How does an ACL reconstruction (ACLR) affect an MLB player’s performance after returning to competition?
ACL injuries can impair knee stability, acceleration, deceleration, rotational movement and agility—all qualities particularly important for baserunning and fielding. Previous research in professional baseball has largely focused on return-to-play rates and traditional statistics, leaving less evidence on how ACL reconstruction affects advanced performance metrics.
This study addresses that gap by using Statcast and advanced baseball analytics to compare MLB fielders before and after ACL reconstruction with a matched group of uninjured players.
The central finding is particularly interesting:
Players showed measurable declines in speed, baserunning and defensive performance after ACLR—but batting performance remained relatively stable.
Authors:
Po-Chun Chi
Min-Hao Sun
Yu-Che Lee
Cheng-Pang Yang
Joe Chih-Hao Chiu
Yi Lu
You can check out the full study by clicking on the link below:
🧪 Study Overview
Study Type
Retrospective, matched case-control study.
Study Period
2015–2023, corresponding with the availability of MLB Statcast data.
Participants
The researchers initially identified 27 MLB players who underwent ACL reconstruction.
After excluding pitchers, players who did not meet the return-to-competition criteria and players without sufficient performance data:
14 MLB fielders were included in the final analysis.
They were compared with 28 matched controls.
Controls were matched according to defensive position, batting side, age and pre-injury fWAR. Performance after anterior cruc…
To qualify, ACLR players needed at least 100 plate appearances before surgery and at least 100 after returning to MLB competition. Performance after anterior cruc…
Performance Categories
🏃 Baserunning
Sprint speed
Extra Bases Taken (XBR)
Ultimate Base Running (UBR)
Weighted Stolen Bases (wSB)
Base Running Score (BSR)
Home plate-to-first-base time
🧤 Defense
Defensive Runs Saved (DRS)
Ultimate Zone Rating (UZR)
⚾ Batting
OPS
wRC+
fWAR / bWAR
Maximum and average exit velocity
Barrel %
Barrels per plate appearance Performance after anterior cruc…
📈 Key Findings
🏃 Sprint Speed Declined After ACL Reconstruction
One of the clearest effects involved running speed.
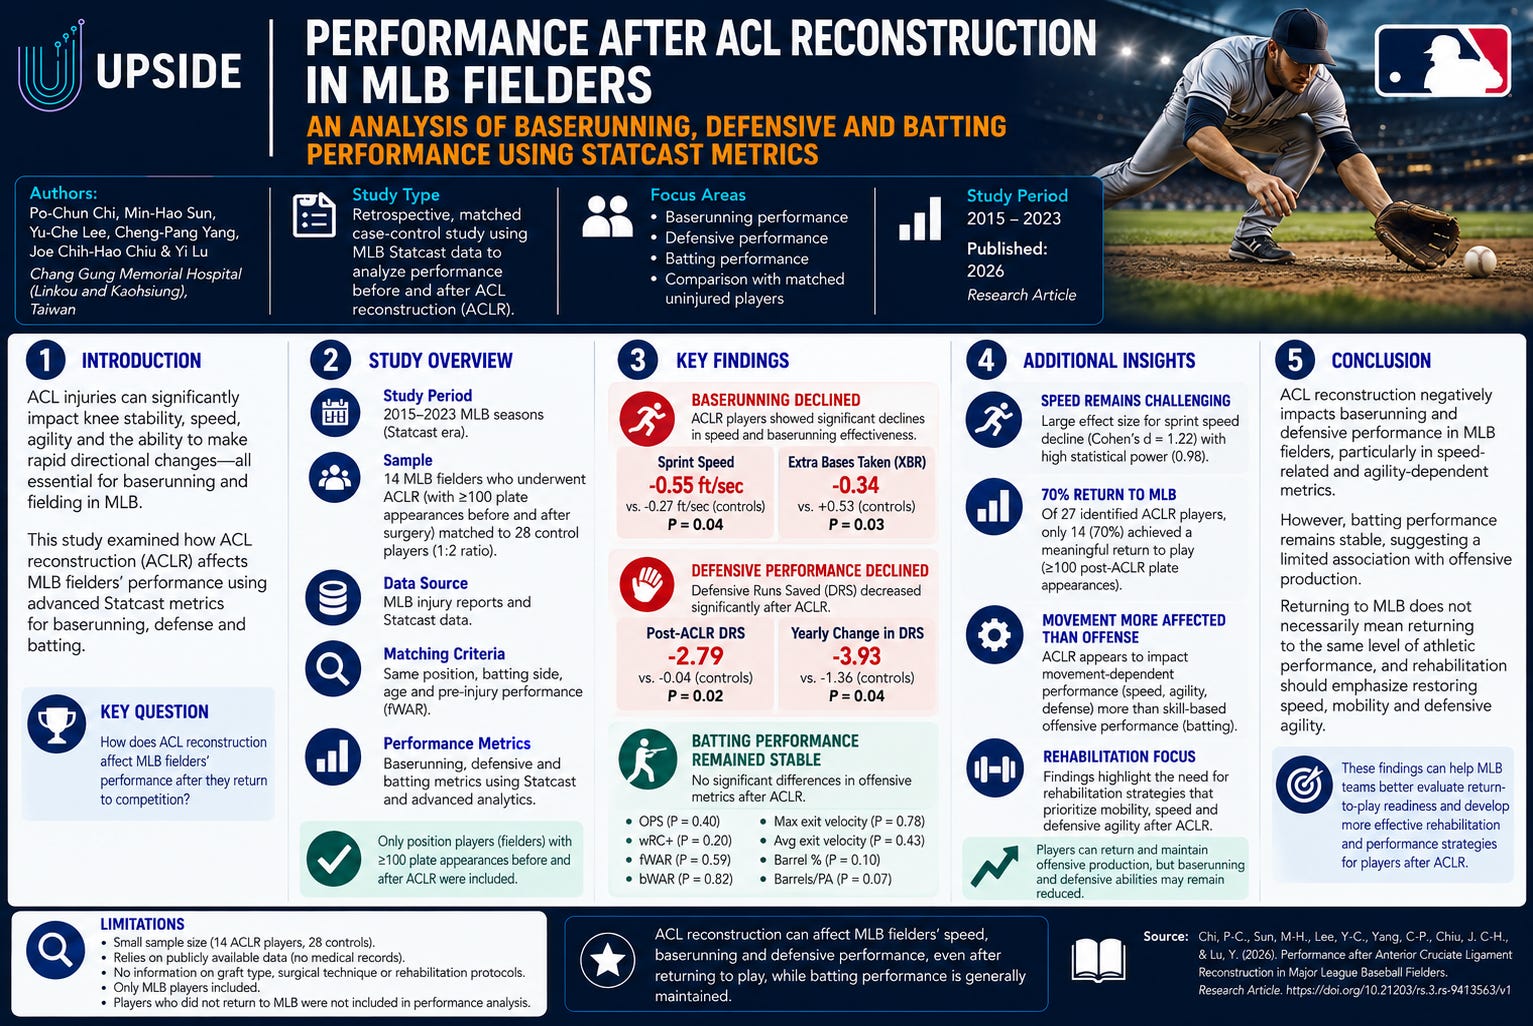
Compared with the control group, ACLR players experienced a significantly greater reduction in sprint speed:
ACLR players: ↓ 0.55 ft/sec
Controls: ↓ 0.27 ft/sec
P = 0.04
The study’s post-hoc analysis found a large standardized effect for sprint speed (Cohen’s d = 1.22) with statistical power of 0.98. Performance after anterior cruc… Performance after anterior cruc…
This suggests that restoring straight-line speed may remain challenging even after a player has successfully returned to MLB competition.
🏃♂️ Baserunning Effectiveness Also Declined
Extra Bases Taken (XBR)—which reflects a player’s ability to advance additional bases—also declined significantly.
ACLR players: ↓ 0.34
Controls: ↑ 0.53
P = 0.03
Other baserunning metrics, including UBR, wSB and BSR, did not show statistically significant differences. Performance after anterior cruc…
The researchers argue that the XBR decline may reflect the combined impact of reduced speed, agility and ability to execute explosive changes of direction after ACL reconstruction.
🧤 Defensive Performance Was Negatively Affected
The other major finding involved Defensive Runs Saved (DRS).
In the post-reconstruction season:
ACLR players: -2.79 DRS
Controls: -0.04 DRS
P = 0.02
The year-to-year change was also significantly worse:
ACLR: ↓ 3.93 DRS
Controls: ↓ 1.36 DRS
P = 0.04.
Interestingly, Ultimate Zone Rating (UZR) did not significantly change.
The researchers suggest DRS may better capture dynamic defensive actions involving range, rapid adjustments and playmaking, while more routine defensive skills and positioning may remain relatively preserved.
⚾ Batting Performance Remained Stable
Perhaps the most surprising result was what didn’t significantly decline.
The researchers found no significant post-ACLR differences across batting metrics including:
OPS
wRC+
fWAR
bWAR
Maximum exit velocity
Average exit velocity
Barrel %
Barrels per plate appearance.
The authors interpret this as evidence that ACL reconstruction may affect movement-dependent baseball performance more than skill-based offensive performance.
Batting relies heavily on coordination, timing and technical skill, potentially allowing players to maintain offensive production despite lingering lower-body mobility limitations.
🚨 Returning to MLB Competition Is Not Guaranteed
Another important finding appears in the study’s discussion.
Of the players identified with ACL reconstruction, only 70% achieved what the researchers defined as a meaningful return to play—at least 100 plate appearances in a post-reconstruction MLB season.
Nearly 30% failed to reach that threshold. Performance after anterior cruc…
This distinction matters because simply being medically cleared or appearing in an MLB game does not necessarily mean a player has returned to a sustained level of major-league participation.
📊 By the Numbers
⚾ 27 MLB players identified as having undergone ACLR between 2015–2023.
👥 14 fielders included in the final performance analysis.
🆚 28 matched control players.
🏃 -0.55 ft/sec change in sprint speed among ACLR players.
📉 -0.34 change in Extra Bases Taken (XBR).
🧤 -3.93 year-to-year change in Defensive Runs Saved.
⚾ No statistically significant decline across the study’s batting metrics.
📈 70% of identified MLB fielders achieved the study’s meaningful return-to-play threshold of at least 100 post-ACLR plate appearances.
🧠 Implications for MLB Teams and Performance Departments
The study suggests an important distinction between returning to play and returning to performance.
A player may successfully return to an MLB lineup while still experiencing deficits in qualities such as:
Sprint speed
Explosive acceleration
Agility
Directional changes
Defensive range
Dynamic fielding ability
At the same time, offensive production may be comparatively resilient.
For teams, this suggests post-ACLR evaluation should not rely solely on whether a player can hit effectively or accumulate playing time. Baserunning and defensive mobility may provide important additional indicators of functional recovery. This aligns with the authors’ practical implications.
📌 Recommendations
For MLB Performance & Medical Staff
Place greater emphasis on restoring sprint speed and acceleration during ACL rehabilitation.
Include multidirectional agility and rapid changes of direction in return-to-performance testing.
Assess defensive range and mobility rather than relying solely on traditional return-to-play criteria.
Continue monitoring players after their return to MLB competition because successful RTP does not necessarily mean full performance restoration.
Use player-specific baselines from tracking technologies such as Statcast when evaluating recovery.
For MLB Front Offices
The authors specifically suggest decision-makers consider the longer-term impact of ACLR on baserunning and fielding—not simply batting—when evaluating player readiness and contract value.
⚠️ Limitations
There are several important limitations.
The study included only 14 ACLR players and 28 controls, limiting its ability to identify smaller effects. The authors note that the XBR result, for example, had relatively low statistical power despite reaching statistical significance.
Other limitations include:
Data came from publicly available sources rather than medical records.
Researchers did not have information about graft type, surgical technique, postoperative complications or individual rehabilitation programs.
Only MLB-level players were analyzed.
The study period was restricted to 2015–2023 because of Statcast availability.
Players who failed to successfully return were largely excluded from the performance analysis.
Selecting the optimal advanced metric for baserunning, fielding and batting remains challenging.
✅ Conclusion
This study provides an important insight into ACL reconstruction in professional baseball:
Returning to MLB does not necessarily mean returning to the same level of athletic performance.
MLB fielders who underwent ACL reconstruction experienced significant declines in sprint speed, extra-base running and Defensive Runs Saved, while advanced batting metrics remained largely unchanged.
The findings suggest ACLR may affect movement-based qualities—speed, agility and defensive mobility—more than skill-based offensive performance.
For MLB performance departments, this reinforces the importance of moving beyond traditional return-to-play criteria. Rehabilitation should place particular emphasis on restoring speed, lower-extremity stability, multidirectional agility, directional changes and field coverage before assuming that a player has fully returned to pre-injury performance.
🏒 Upside NHL Study: What Makes an Elite NHL Career? A Systems-Level Analysis of Draft, Development, and Hockey Capital
Published online in the International Journal of Performance Analysis in Sport (2026) by Taylor G. Hill & Samantha K. Williams, Department of Psychology and Neuroscience, Dalhousie University.
🧩 Introduction
What actually determines whether an NHL player develops into an elite, long-term performer?
Is it primarily where they are drafted? The development system they come through? Their country of origin? Or a combination of all three?
This study takes a systems-level approach to NHL talent development. Rather than focusing primarily on individual characteristics such as age, height or body mass, the researchers examined how draft position, development pathways and national hockey systems are associated with career outcomes.
Using data from 8,782 NHL players from 1979–2025, the researchers created the NHL Career Outcomes and Trajectories Database and introduced a concept they call “hockey capital”—a system’s capacity to produce, sustain and convert player development into NHL career outcomes.
The central takeaway:
Elite NHL careers appear to emerge from a combination of talent identification, development environment and systemic opportunity—not from a single pathway or factor.
Authors:
Taylor G. Hill
Samantha K. Williams
Department of Psychology and Neuroscience
Dalhousie University, Halifax, Canada.
You can check out the full study by clicking on the button below:
🧪 Study Overview
Study Type
Large-scale descriptive and distributional analysis of NHL career outcomes.
The researchers used descriptive statistics, percentile-based success measures, correlations, regression models and K-means clustering to investigate NHL career patterns.
Study Period
1979–2025
Dataset
🏒 8,782 NHL players
4,737 drafted players
4,045 undrafted players
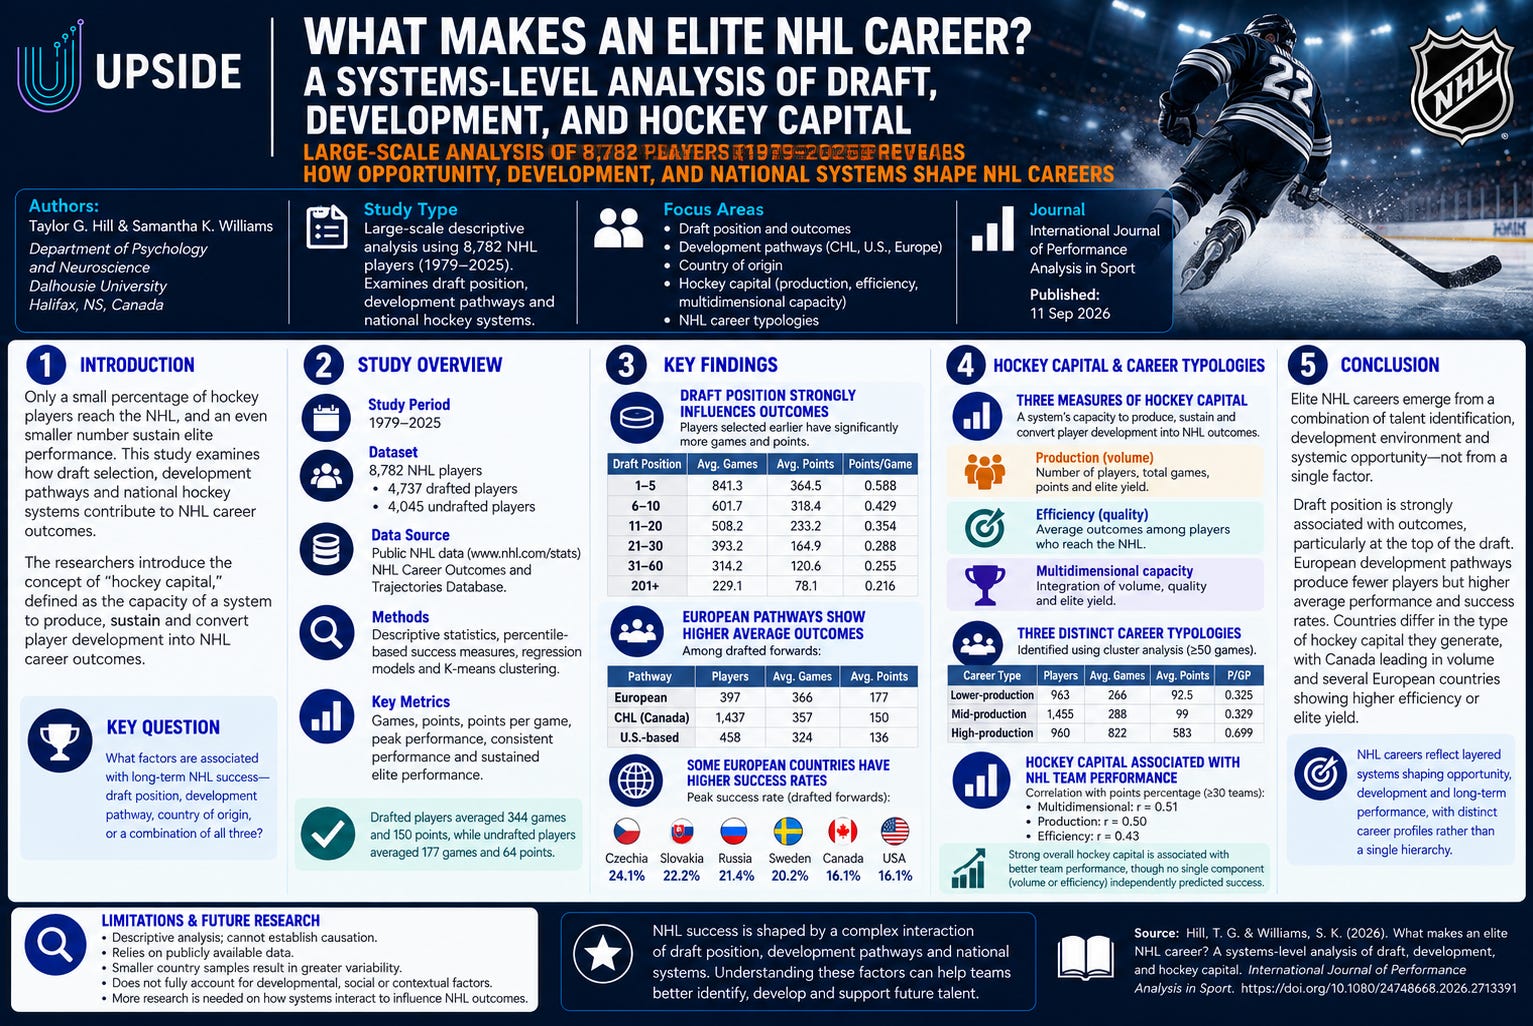
Drafted players averaged 344 NHL games and 150 career points, while undrafted players averaged 177 games and 64 points.
Key Areas Analyzed
Draft position
Development pathway
Country of origin
Career games and points
Points per game
Peak performance
Consistent performance
Sustained elite performance
National “hockey capital”
NHL career typologies
Relationship between hockey capital and current team performance
The researchers defined three forms of success:
Peak success: reaching the top 10% of NHL scorers during at least one season.
Consistent success: maintaining an average seasonal scoring percentile of at least 75%.
Career success: reaching the top 1% in points for at least three seasons.
📈 Key Findings
🎯 Draft Position Matters—Especially at the Very Top
One of the strongest findings was the relationship between draft position and NHL career outcomes.
Players selected with the first overall pick averaged:
939 NHL games
759 career points
Among players drafted 1–5 overall:
841.3 average games
544.5 average points
0.588 points/game
The decline is steep even within the first round.
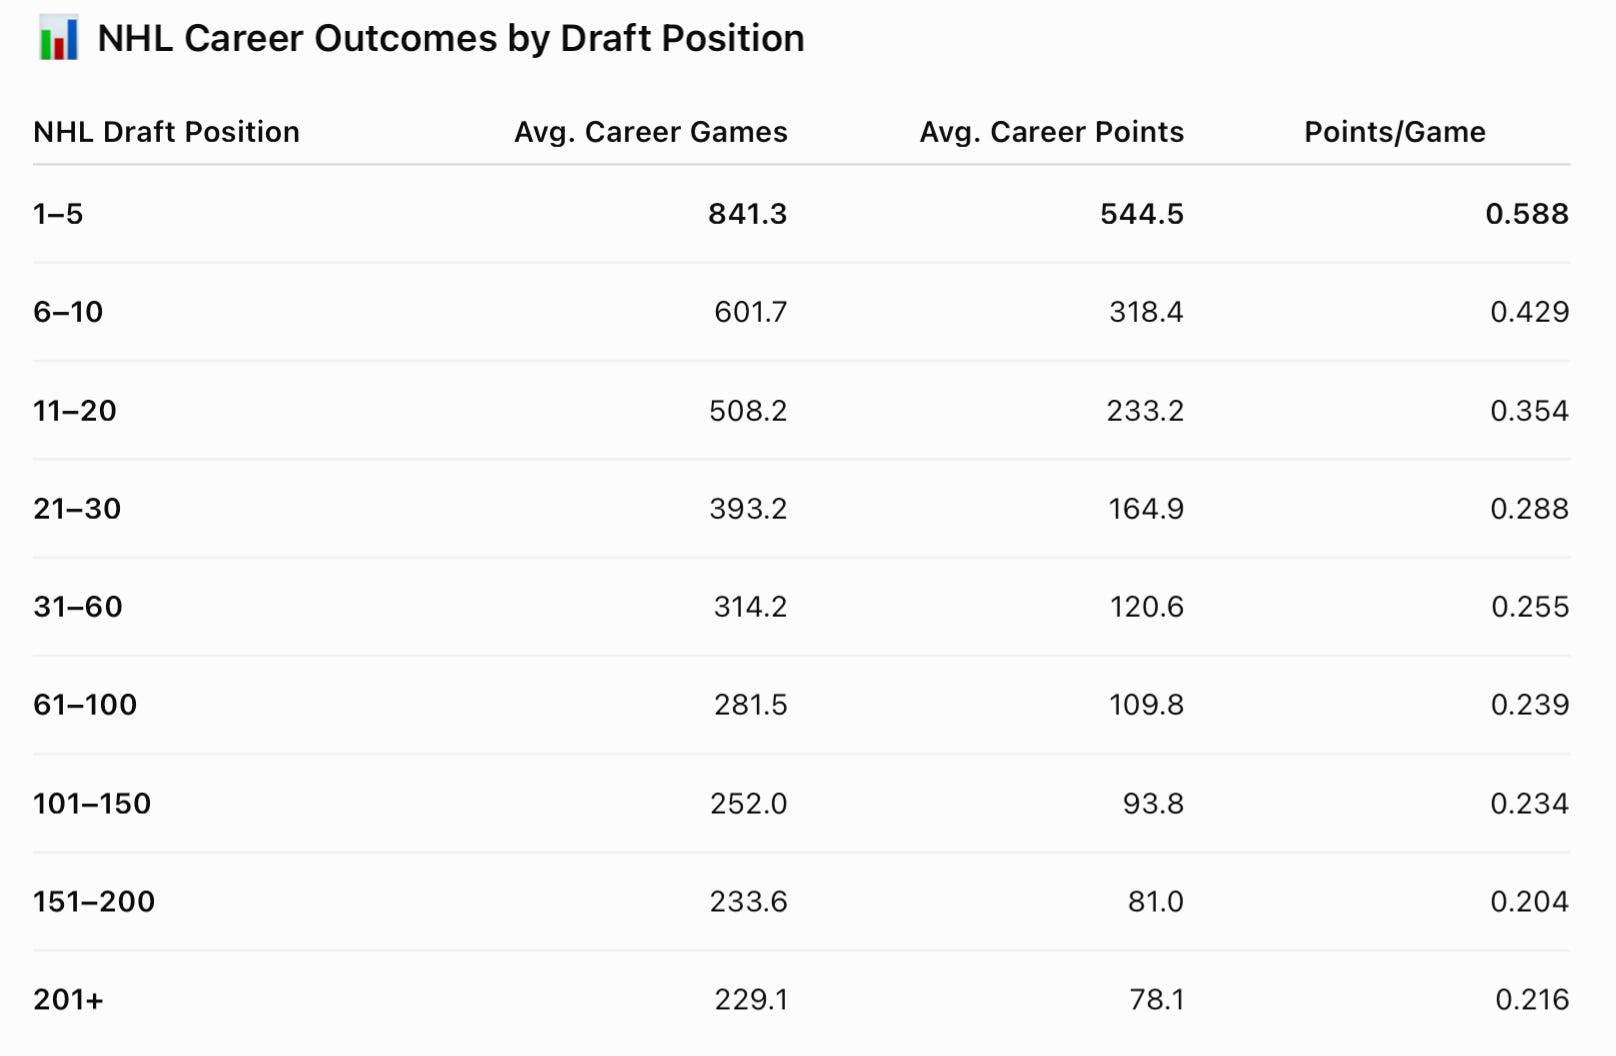
Players selected after pick 200 had a median of only 66 NHL games and 12 career points. What makes an elite NHL career … What makes an elite NHL career …
The study therefore supports the value of NHL scouting and draft position—particularly among very early selections—but also shows substantial variation in long-term outcomes.
🌍 European Development Pathways Showed Higher Average Outcomes
The researchers compared three major development routes among drafted forwards:
🇨🇦 Canadian Hockey League (CHL)
🇺🇸 U.S.-based development pathways
🇪🇺 European development pathways
The CHL produced by far the greatest number of players:
CHL: 1,437 players
U.S.: 458
Europe: 397
However, European-developed players had the highest average NHL career outcomes:
Europe: 366 games / 177 points
CHL: 357 games / 150 points
U.S.: 324 games / 136 points.
Even more interesting were the success rates.
European pathways
🏆 Peak success: 17.7%
📈 Consistent success: 12.3%
⭐ Sustained career success: 12.6%
U.S. pathways
🏆 Peak: 15.2%
📈 Consistent: 8.8%
⭐ Career: 8.2%
CHL
🏆 Peak: 16.6%
📈 Consistent: 10.3%
⭐ Career: 9.5%. What makes an elite NHL career …
Importantly, these are descriptive differences; the study does not establish that the development pathway itself causes the outcomes.
⭐ Truly Elite NHL Careers Are Extremely Rare
Among drafted forwards analyzed for career success, only a relatively small percentage reached the study’s elite-performance thresholds.
Approximately:
17.4% achieved peak success.
9.4% achieved consistent success.
10.1% achieved sustained career success.
At an even more extreme threshold—the top 1% of career point totals—only 28 of 2,789 drafted skaters qualified.
The threshold was approximately 1,224 career points.
This illustrates just how concentrated exceptional NHL career performance is.
🌎 Canada Produces the Most NHL Talent—but Some European Countries Show Higher Success Rates
Canada remains the dominant NHL talent producer.
Among drafted players:
🇨🇦 Canada: 51.7%
🇺🇸 United States: 19.8%
Together, North America represented more than 70% of drafted players in the dataset.
However, several European countries showed higher proportional rates of peak or sustained success among drafted forwards.
For example:
Peak Success
🇨🇿 Czechia — 24.1%
🇸🇰 Slovakia — 22.2%
🇷🇺 Russia — 21.4%
🇸🇪 Sweden — 20.2%
🇫🇮 Finland — 17.5%
🇨🇦 Canada — 16.1%
🇺🇸 USA — 16.1%
For sustained career success, Czechia recorded 15.7%, compared with 9.5% for Canada and 8.5% for the United States.
Again, these differences should be interpreted in the context of different player-pool sizes and selection effects.
🧠 A New Concept: “Hockey Capital”
One of the study’s most interesting contributions is the concept of hockey capital.
The researchers define it as the capacity of a system to produce, sustain and convert player development into NHL career outcomes.
They created three measures.
🏭 1. Production Hockey Capital
Measures volume, including:
Number of drafted players
Total NHL games
Total career points
Number achieving peak success
Canada was by far the strongest production system, followed by the United States. What makes an elite NHL career …
🎯 2. Efficiency Hockey Capital
Measures the average outcomes of players who make it into the NHL system, including career games, points and elite-success rates.
Here the pattern changed dramatically:
1. Czechia
2. Sweden
3. Russia
Canada ranked fourth among the countries included, while the United States ranked sixth.
The authors note that lower-volume or more selective systems tended to have stronger average outcomes among players who reached the NHL.
🧩 3. Multidimensional Hockey Capital
Combines:
Volume + Quality + Elite Yield
On this measure:
Canada: z = 0.61
Czechia: z = 0.57
Sweden: z = 0.27
Russia: z = -0.03
USA: z = -0.21
Slovakia: z = -0.54
Finland: z = -0.67
Canada’s result was driven largely by its extraordinary production volume, while Czechia and Sweden combined smaller player pools with higher efficiency.
📊 Three Types of NHL Careers
The researchers also used machine-learning-style clustering to identify three distinct NHL career typologies among skaters with at least 50 games.
🔹 Lower-Production Careers
963 players
Average:
266 games
92.5 points
.325 points/game
25.3-point peak season
🔹 Mid-Production Careers
1,455 players
Average:
288 games
99 points
.329 points/game
27.5-point peak season
🔹 High-Production Careers
960 players
Average:
822 games
583 points
.699 points/game
76.3-point peak season
High-production players also generated more shots while recording lower penalty-minute rates.
The finding supports the authors’ broader argument that NHL careers do not simply fall along one linear continuum; there appear to be distinct career profiles and trajectories.
📊 By the Numbers
🏒 8,782 NHL players analyzed from 1979–2025.
🎯 4,737 drafted players.
🇨🇦 51.7% of drafted players were Canadian.
🇺🇸 19.8% were American.
🥇 939 games / 759 points — averages for first-overall selections.
🔥 841 games / 545 points — averages for picks 1–5.
🇪🇺 12.6% — sustained career-success rate among European-pathway players.
⭐ ~10% — proportion of drafted forwards meeting the study’s sustained career-success criterion.
🏆 28 of 2,789 — drafted skaters reaching the study’s top-1%-of-career-points threshold.
📈 822 games / 583 points — averages for the high-production career cluster.
🏆 Hockey Capital and NHL Team Performance
The researchers also examined whether hockey capital was associated with current NHL team success.
Across the league’s 32 teams:
Multidimensional hockey capital: r = .51 with points percentage
Production hockey capital: r = .50
Efficiency hockey capital: r = .43
In a single-predictor regression, multidimensional hockey capital significantly predicted points percentage (p = .003).
However, when production and efficiency were entered simultaneously, neither independently reached conventional statistical significance. The more detailed volume/quality/elite-yield model likewise found no individually significant component. What makes an elite NHL career …
So the evidence points to an association between stronger overall hockey-capital profiles and team performance, rather than demonstrating that any single component causes teams to win.
🧠 Implications for NHL Teams and Player Development Departments
The study provides several useful insights for NHL organizations.
First, draft position matters enormously at the top, but becomes less informative as teams move deeper into the draft.
Second, teams may benefit from evaluating a player’s development environment alongside individual performance data. The pathway through which a player develops can shape competitive exposure, visibility, coaching and opportunities before NHL entry.
Third, the European findings are particularly interesting for scouting departments. European pathways produced fewer players in this dataset but showed stronger average career outcomes and proportional elite-success rates.
Finally, the hockey-capital framework suggests that talent systems can be evaluated across at least three different dimensions:
How many players do they produce?
How good are the players who emerge?
How effectively does the system convert its pipeline into sustained elite NHL careers?
Those are not necessarily the same thing.
📌 Recommendations
For NHL Scouting Departments
Place draft position in a broader developmental context rather than treating it as a standalone predictor.
Examine the characteristics of development systems associated with sustained NHL success.
Continue investing heavily in identifying top-of-draft talent, where career-outcome differences are particularly pronounced.
Look beyond player volume when evaluating international talent pipelines.
For Player Development Departments
Benchmark pathways based on long-term career outcomes, not simply how many players reach the NHL.
Study why certain European pathways show comparatively high elite-player yields.
Track development using measures of peak, consistency and sustained performance rather than a single success metric.
Consider how coaching, competition, organizational support and opportunity interact throughout the player’s pathway.
These are practical implications drawn from the patterns reported in the study rather than causal prescriptions established by the analysis.
⚠️ Important Considerations
The analysis is primarily descriptive and distributional, rather than a causal study. Associations between draft position, country, development pathway and NHL success therefore should not be interpreted as proof that those factors themselves caused better careers.
The cross-country comparisons also need context. Smaller player pools can generate more variable success rates, and players reaching the NHL from smaller or more selective systems may already represent a highly selected population. The authors explicitly note greater variability for smaller national samples.
✅ Conclusion
This study challenges the idea that elite NHL careers can be understood simply by identifying the most talented individual players.
Instead, the data suggest that elite careers emerge within a layered system of draft selection, developmental pathways, national hockey infrastructure and professional opportunity.
Three findings stand out:
1. Draft position is strongly associated with NHL career outcomes, particularly among the earliest selections.
2. European development pathways produced fewer players but showed higher average career outcomes and proportional success rates in this dataset.
3. Countries differ substantially in the type of “hockey capital” they generate—Canada dominates player volume, while several European systems show stronger efficiency or elite yield.
For NHL organizations, perhaps the most useful message is that talent identification and talent development should not be viewed as separate processes. Where a player is identified, how that player develops, the opportunities available, and the system surrounding that development may all contribute to the type of NHL career that ultimately emerges.
You may also like:
📚 Upside Studies: (1) MLB Study: Analytic & Pitch-Tracking Metrics Associated with UCL Surgery. (2) WNBA Study: Factors Impacting Wins/Losses (3) Golf: Sleep Study.

⚾ Upside Study: Advanced Analytic and Pitch-Tracking Metrics Associated with UCL Surgery in Major League Baseball Pitchers: A Case-Control Study.
📚 Upside Studies: (1) Basketball Study: Injury Incidence Rate (2) NHL Study: Injury Rates Increase During Olympics? (3) NFL Study: Spending on Star Players & Team Success in the NFL

🏀 Upside Study (1): Injury Incidence Rate According to Mechanism, Body Location, and Type in Basketball Players — A Systematic Review and Meta-Analysis
📚 Upside Studies: (1) NBA Study: Technical Fouls (2)MLB Study: In-Game Markerless & Lab Marker-Based Pitching Biomechanics (3) NHL Study: Determinants of Skating Speed In Ice Hockey Athletes

Upside Study #1: Strategic Impact of Technical Fouls in Basketball: A Two-Decade Analysis of Momentum Shifts in the NBA (2000–2021)